Welcome to the
Chaos Game.
The game is played with three coloured points in a triangle as below,
and a single starting point somewhere in the middle. (It doesn't
actually matter exactly where.)
To play, click the spinner to select a random colour, and then colour the point
exactly half way between the starting point and the vertex of the
chosen colour. This midpoint becomes the new starting point,
and the process is repeated.
Constructing and colouring points in this way gradually makes a
pattern inside the triangle.
Can you guess what this pattern will be?
It takes many points to see the pattern clearly. Use the buttons
below to spin faster, and eventually avoid spinning entirely and just get
the computer to do everything for you.
Many interest variations are possible by changing the number of points
and the way of choosing the new point. The activity supports versions that
use a triangle, a square and a hexagon.
Click here for an explanation of the shape produced by playing the Chaos Game.
A crucial aspect of the Chaos Game is the random choice of vertex.
Barnsley's Fern
is another example of a random point iteration that produces a fractal pattern.
The rules take any point (
x,y) and return a new
x and
y according to:
1% of the time:x → 0,
y → 0.16 y
85% of the time:x → 0.85 x + 0.04 y,
y → −0.04 x + 0.85 y + 1.6
7% of the time:x → 0.2 x − 0.26 y,
y → 0.23 x + 0.22 y + 1.6
7% of the time:x → −0.15 x + 0.28 y,
y → 0.26 x + 0.24 y + 0.44
Click the Show button below to see this process in action.
Notice how each frond is a copy of the whole leaf – self similarity again.
The most famous fractal of all is undoubtedly the Mandelbrot Set.
This is the set of points (c,d) for which the following iterative process converges.
x → x2 - y2 + c,
y → 2xy + d
The points are coloured black if the iteration converges, and thus are part of the set,
but it is at the boundary of the set that things get most interesting.
The boundary curve is infinitely complicated – like the Heighway Dragon, it is a curve with
fractal dimension 2.
When the iteration doesn't converge, a colour is chosen based on how rapidly the iteration diverged.
This creates some wonderful patterns.
Another way to visualise the dynamics is to fix on a particular point (c,d),
and plot how sensitive the iteration is to different starting points.
The shape that results is known as a Julia Set.
For points near the boundary of the Mandelbrot set, the Julia Set itself exhibits
incredibly beautiful, fractal behaviour.
The app below allows you to explore the Mandelbrot set – click and drag to zoom in
on a particular area, or drag backwards to restore the previous zoom.
One interesting activity is to search for smaller copies of the shape, then zoom in on them and find
copies of the copies etc.
The Palette button cycles through different ways to colour the fractal.
To see the Julia set corresponding to a particular point
select the Julia Set button, then click and drag until the crosshairs are
at your point of interested, then release. The corresponding Julia set will be shown, and you
can explore in the same way as for the original Mandelbrot display.
Hitting Reset will restore the Mandelbrot set to the display.
Right click to save an image to disk.
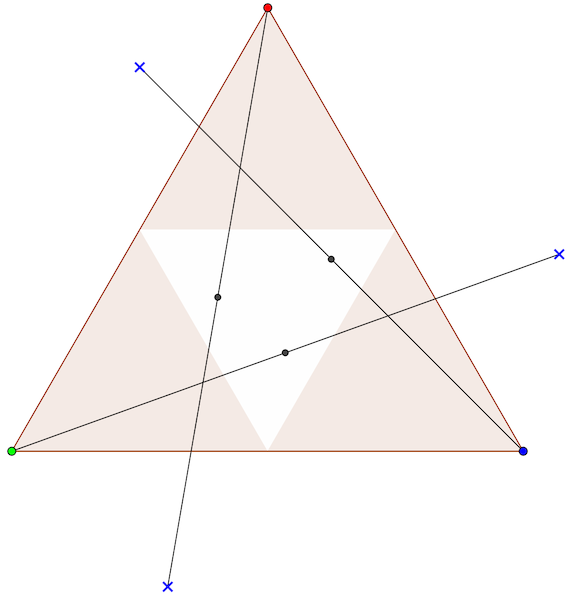 This explains why the middle triangle remains empty, but what about the other triangles?
The reasoning is similar. For any of the smaller empty triangles, the starting point would have
to be in one of the larger empty triangles as shown in the following diagram.
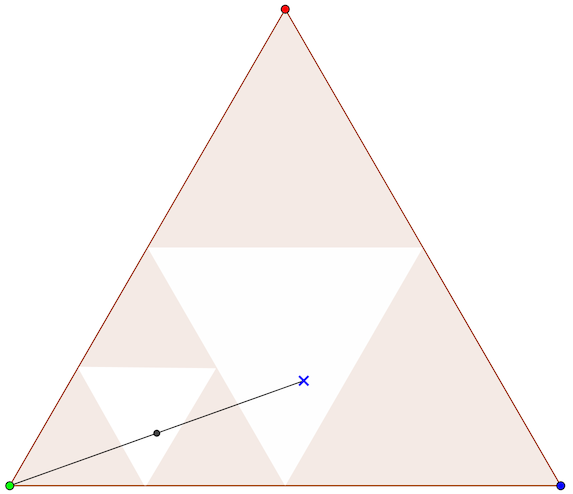
This explains why the middle triangle remains empty, but what about the other triangles?
The reasoning is similar. For any of the smaller empty triangles, the starting point would have
to be in one of the larger empty triangles as shown in the following diagram.
 This is an example of