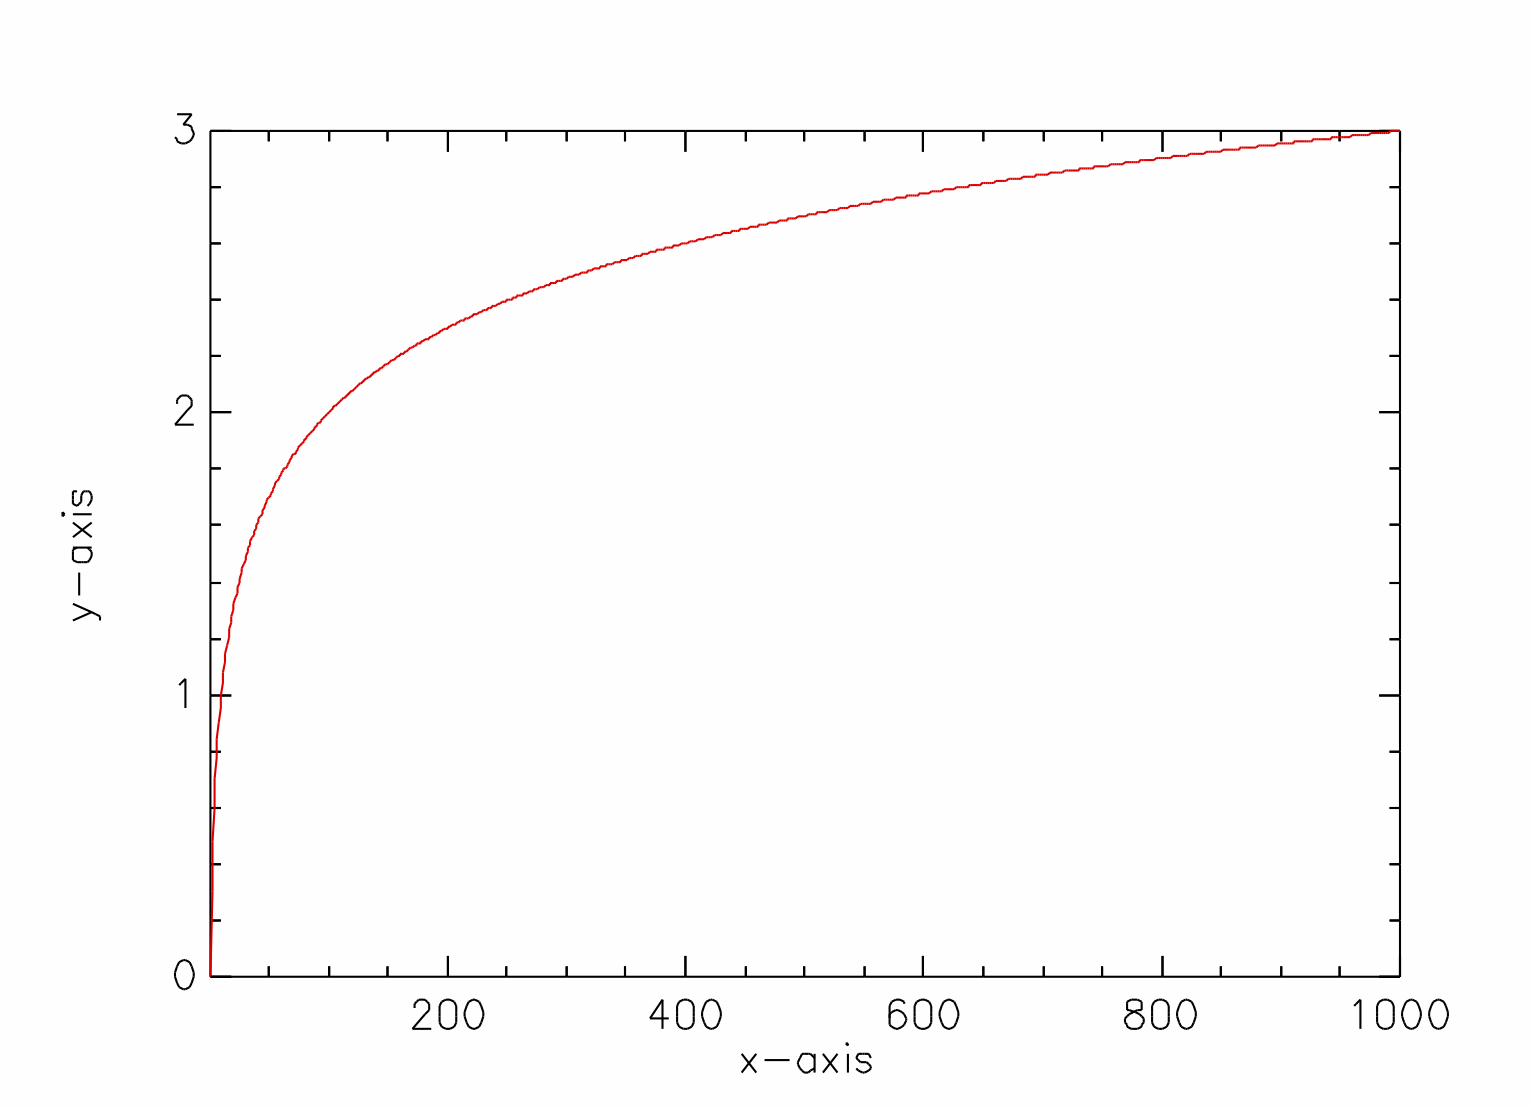
Hello
# d ~ PlotDefs
# d'"xlabel"~"x-axis"
# d'"ylabel"~"y-axis"
# d'"labelstyle"~ITALIC
# LinePlot Log [1:1000] d LineDefs

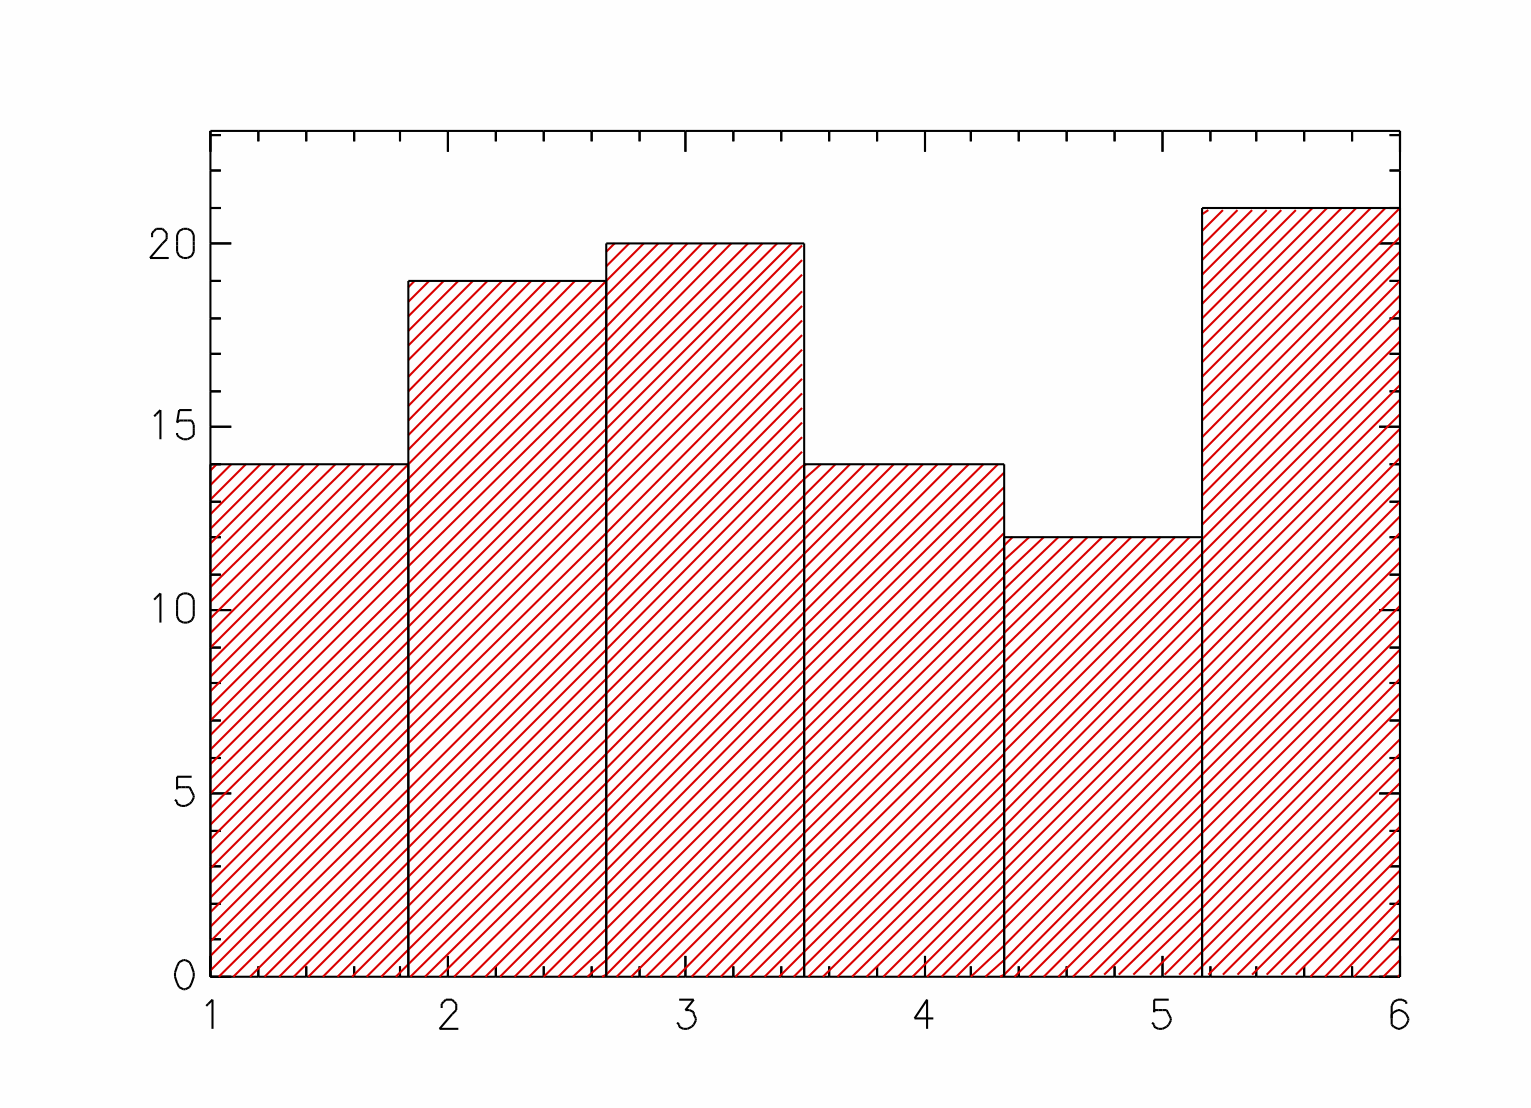
# d~PlotDefs
# d'"fill"~HATCHED
# Histogram Hist Sample [1:6] 100 $1 6 d LineDefs
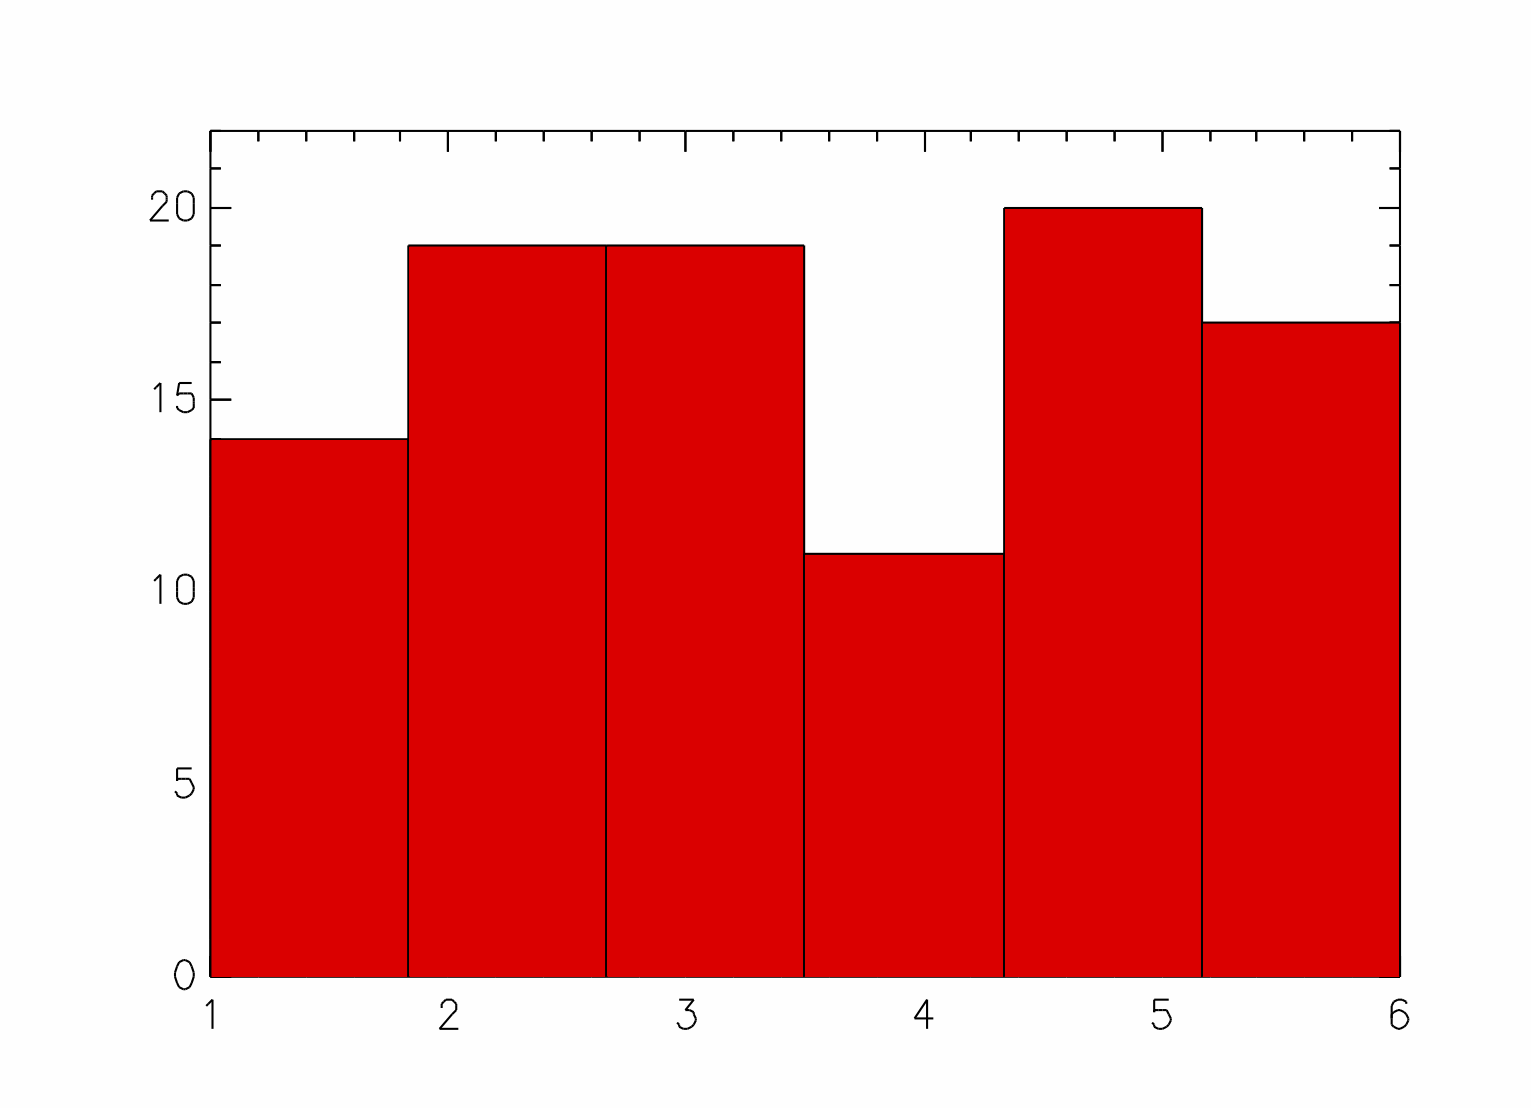
# d'"fill"~SOLID
# Histogram Hist Sample [1:6] 100 $1 6 d LineDefs
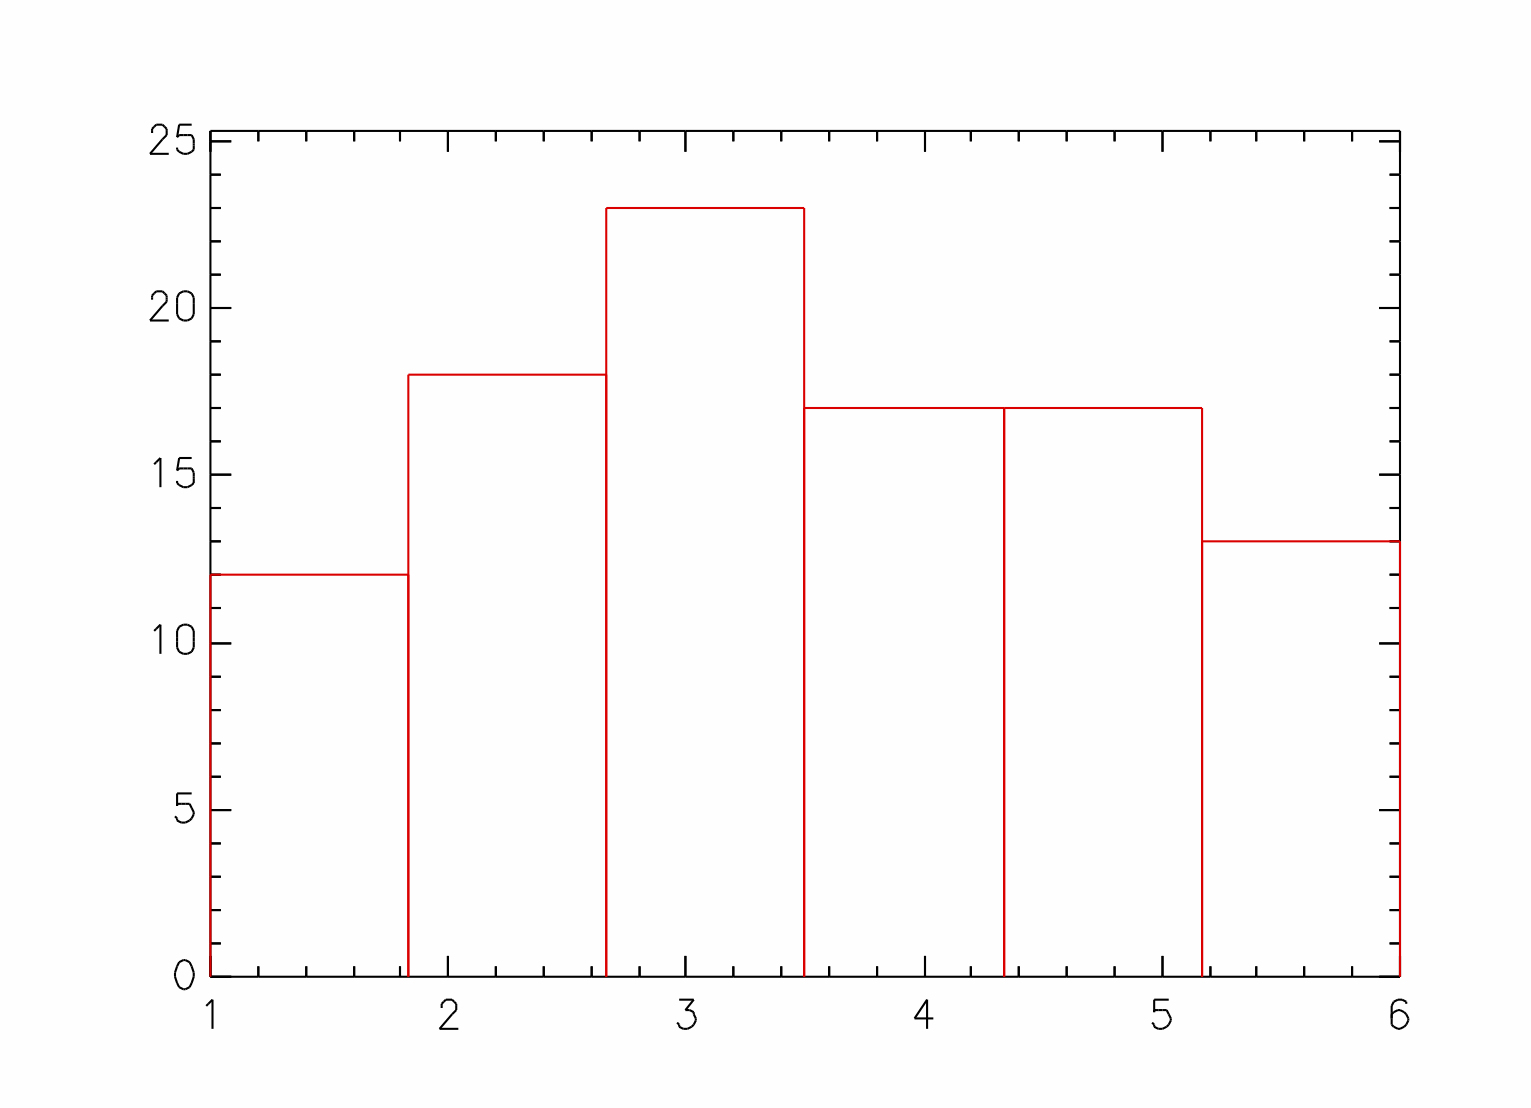
# d'"fill"~NOFILL
# Histogram Hist Sample [1:6] 100 $1 6 d LineDefs
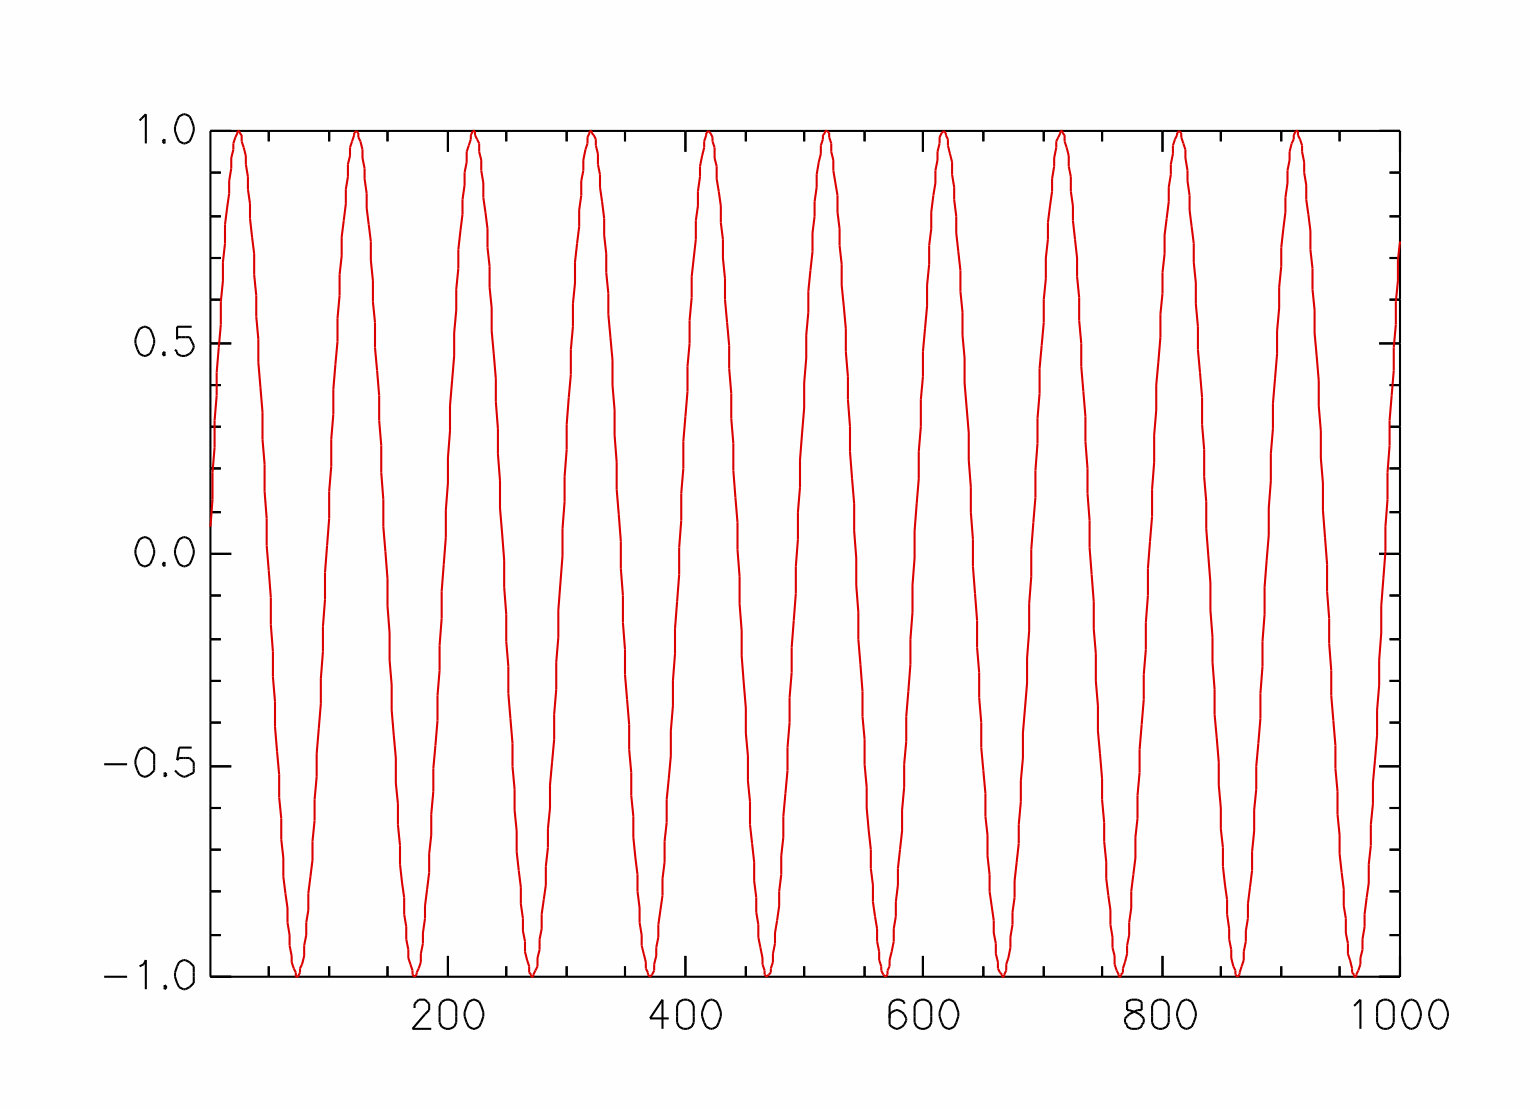
# x ~ Sin ([1:1000] / 5 / Pi)
# LinePlot x PlotDefs LineDefs
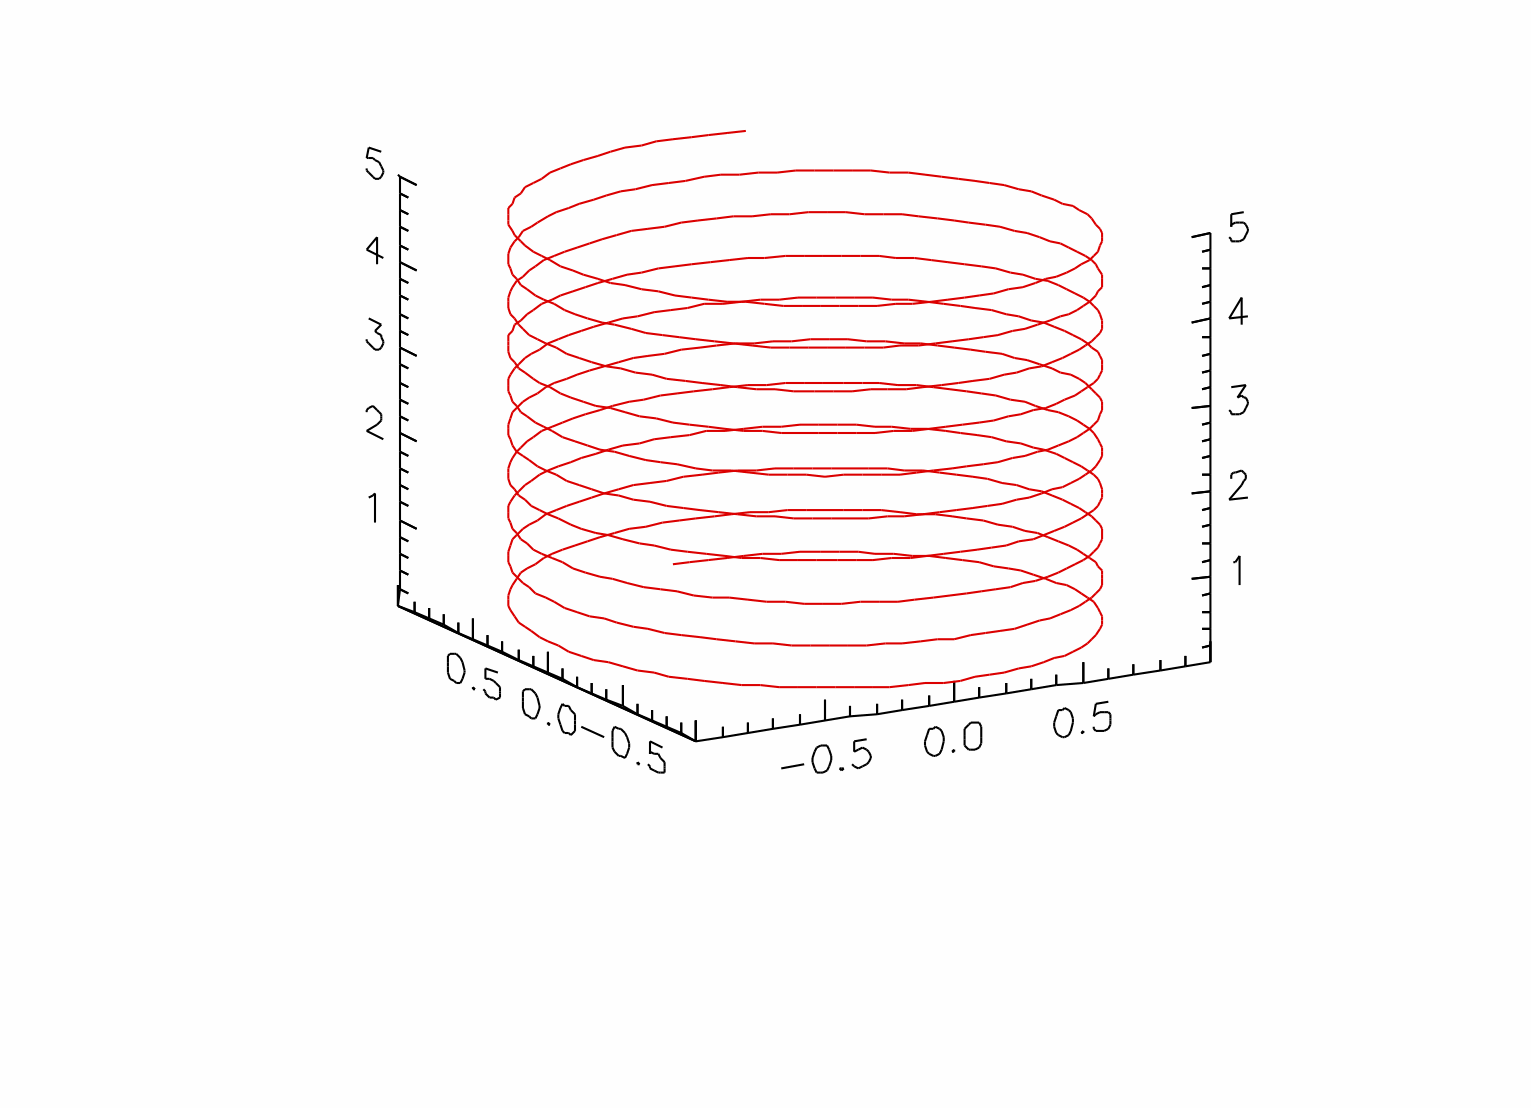
# y ~ Cos ([1:1000] / 5 / Pi)
# z ~ [1:1000] / 200
# LinePlot3 x y z PlotDefs LineDefs
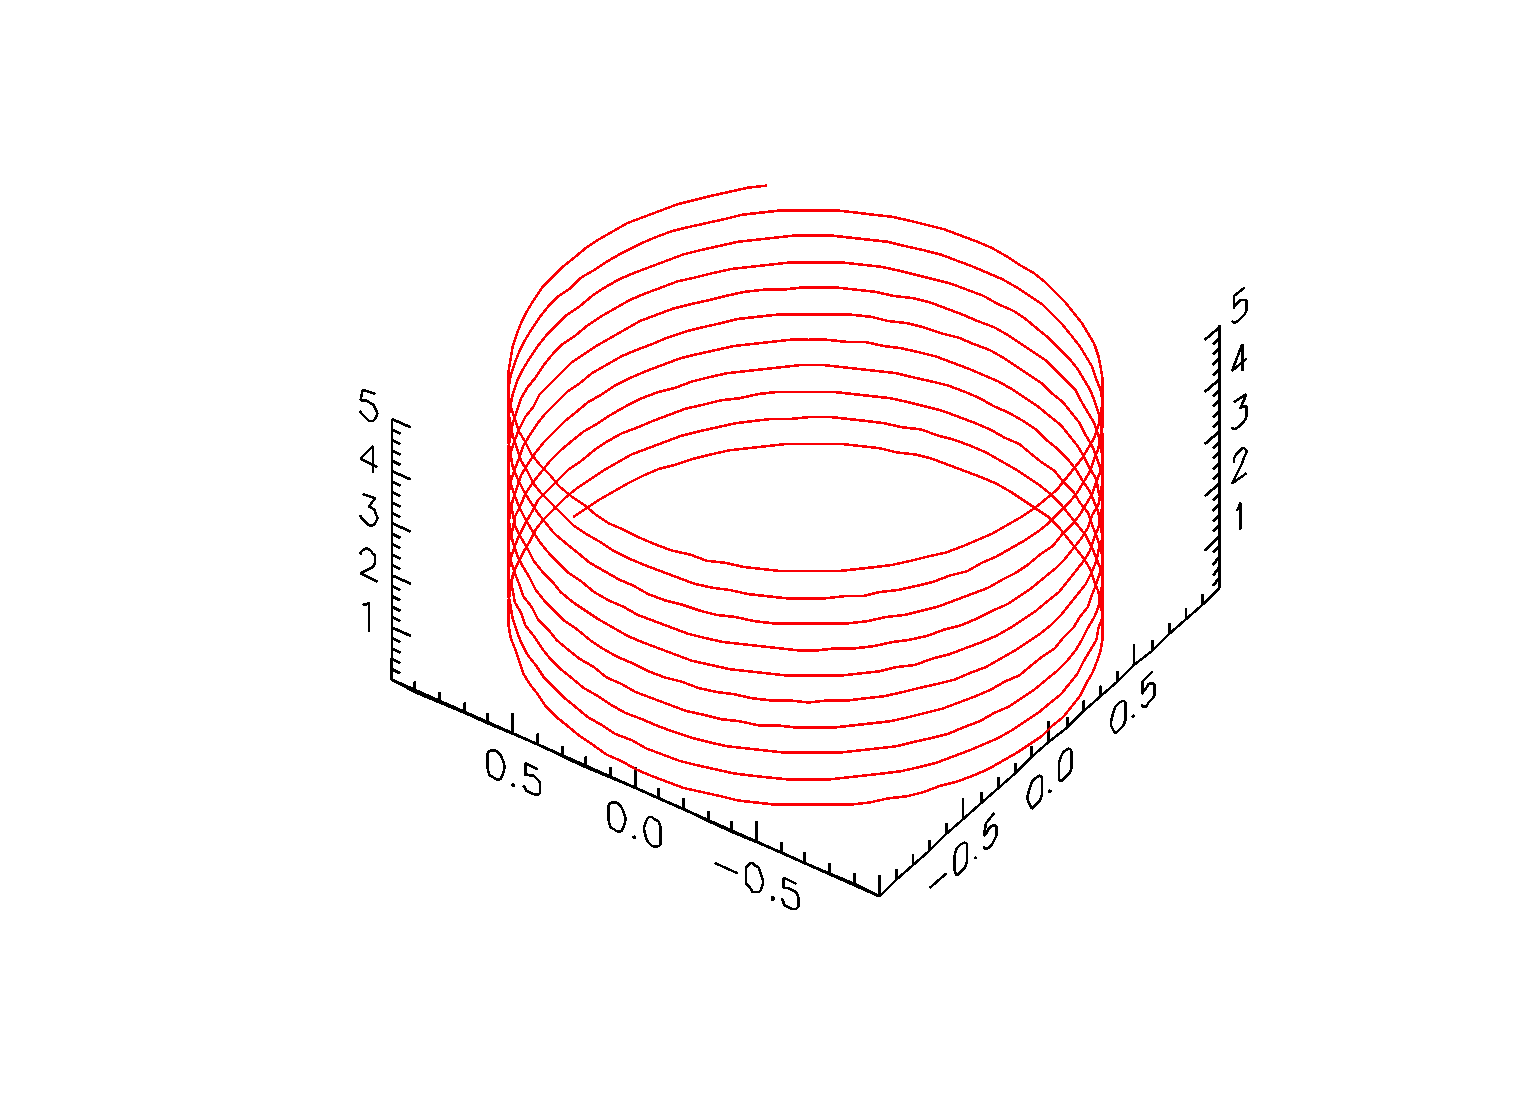
# d~PlotDefs
# d'"elevation"~55
# d'"azimuth"~55
# LinePlot3 x y z d LineDefs
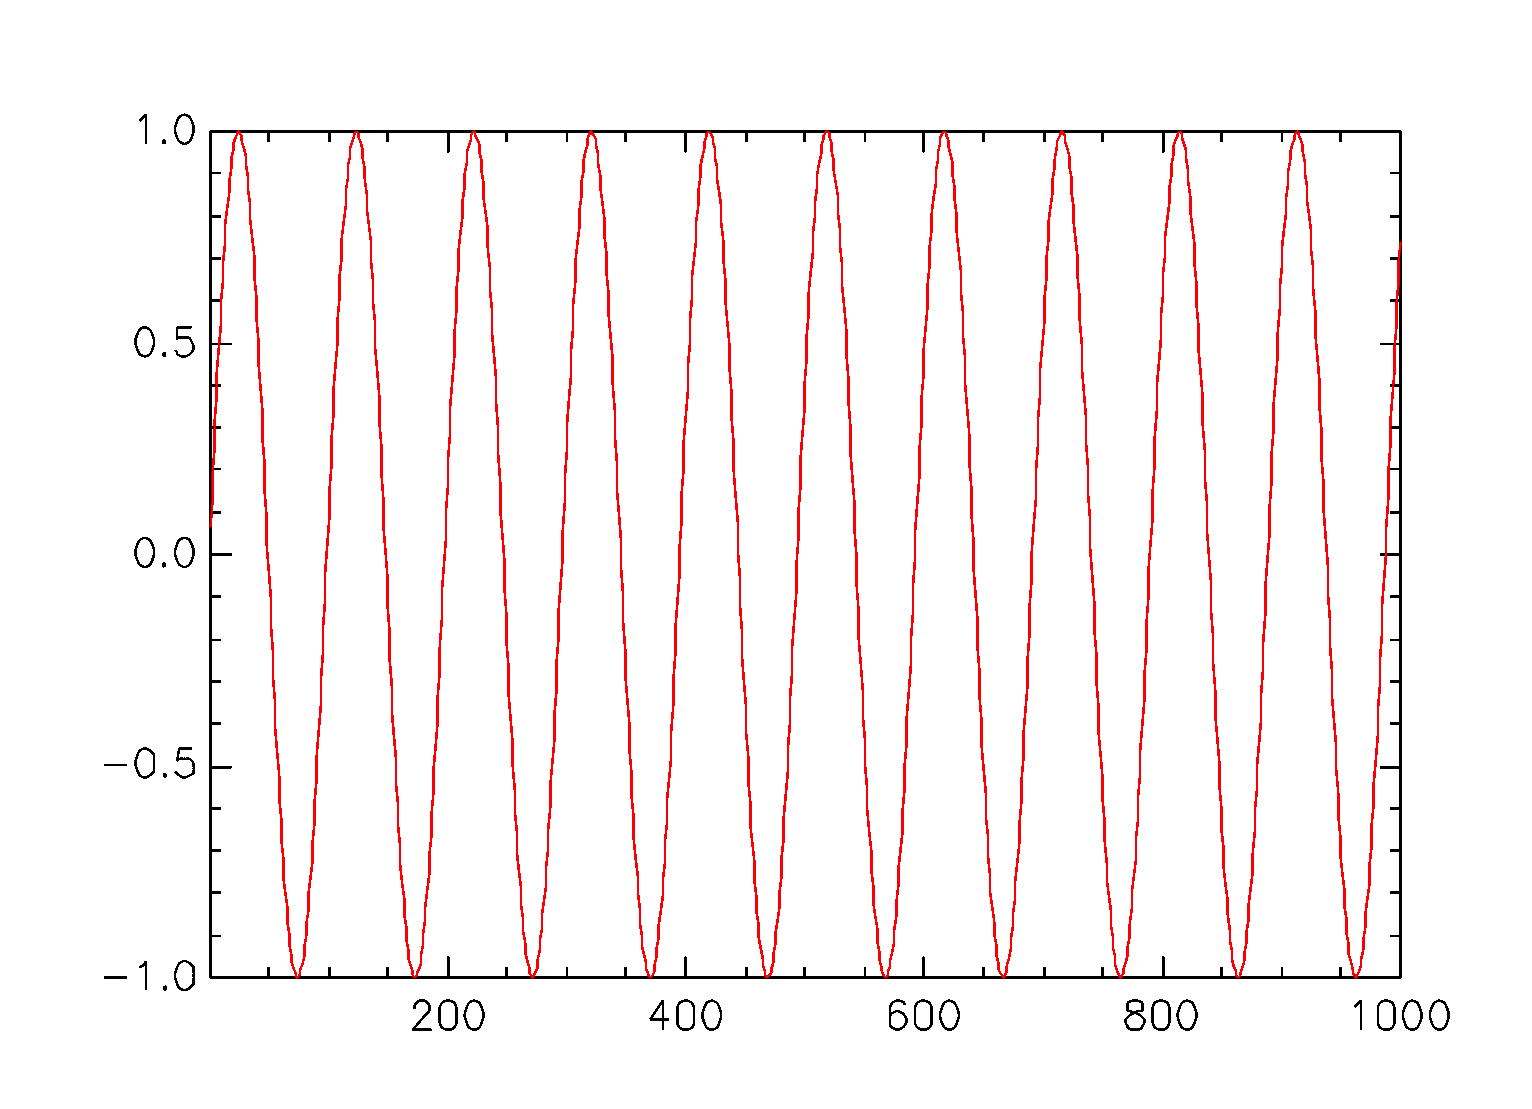
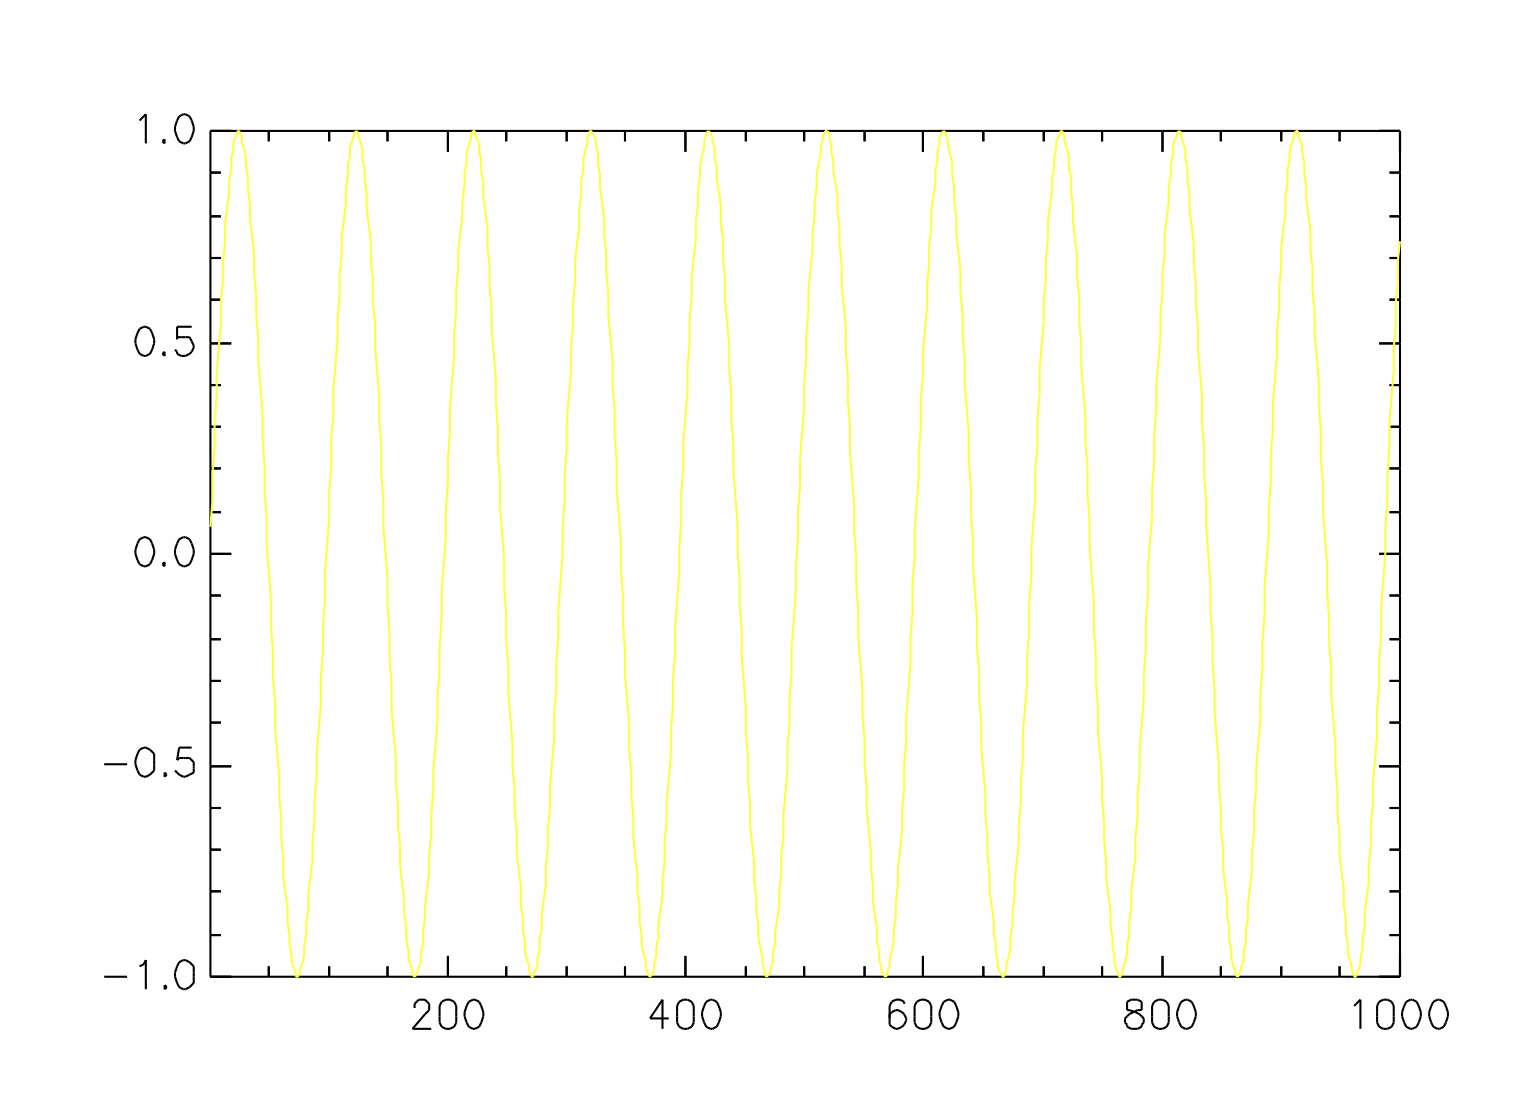
# LinePlot Sin ([1:1000] / 5 / Pi) PlotDefs LineDefs
# l~LineDefs
# l'"colour"~YELLOW
# LinePlot Sin ([1:1000] / 5 / Pi) PlotDefs l
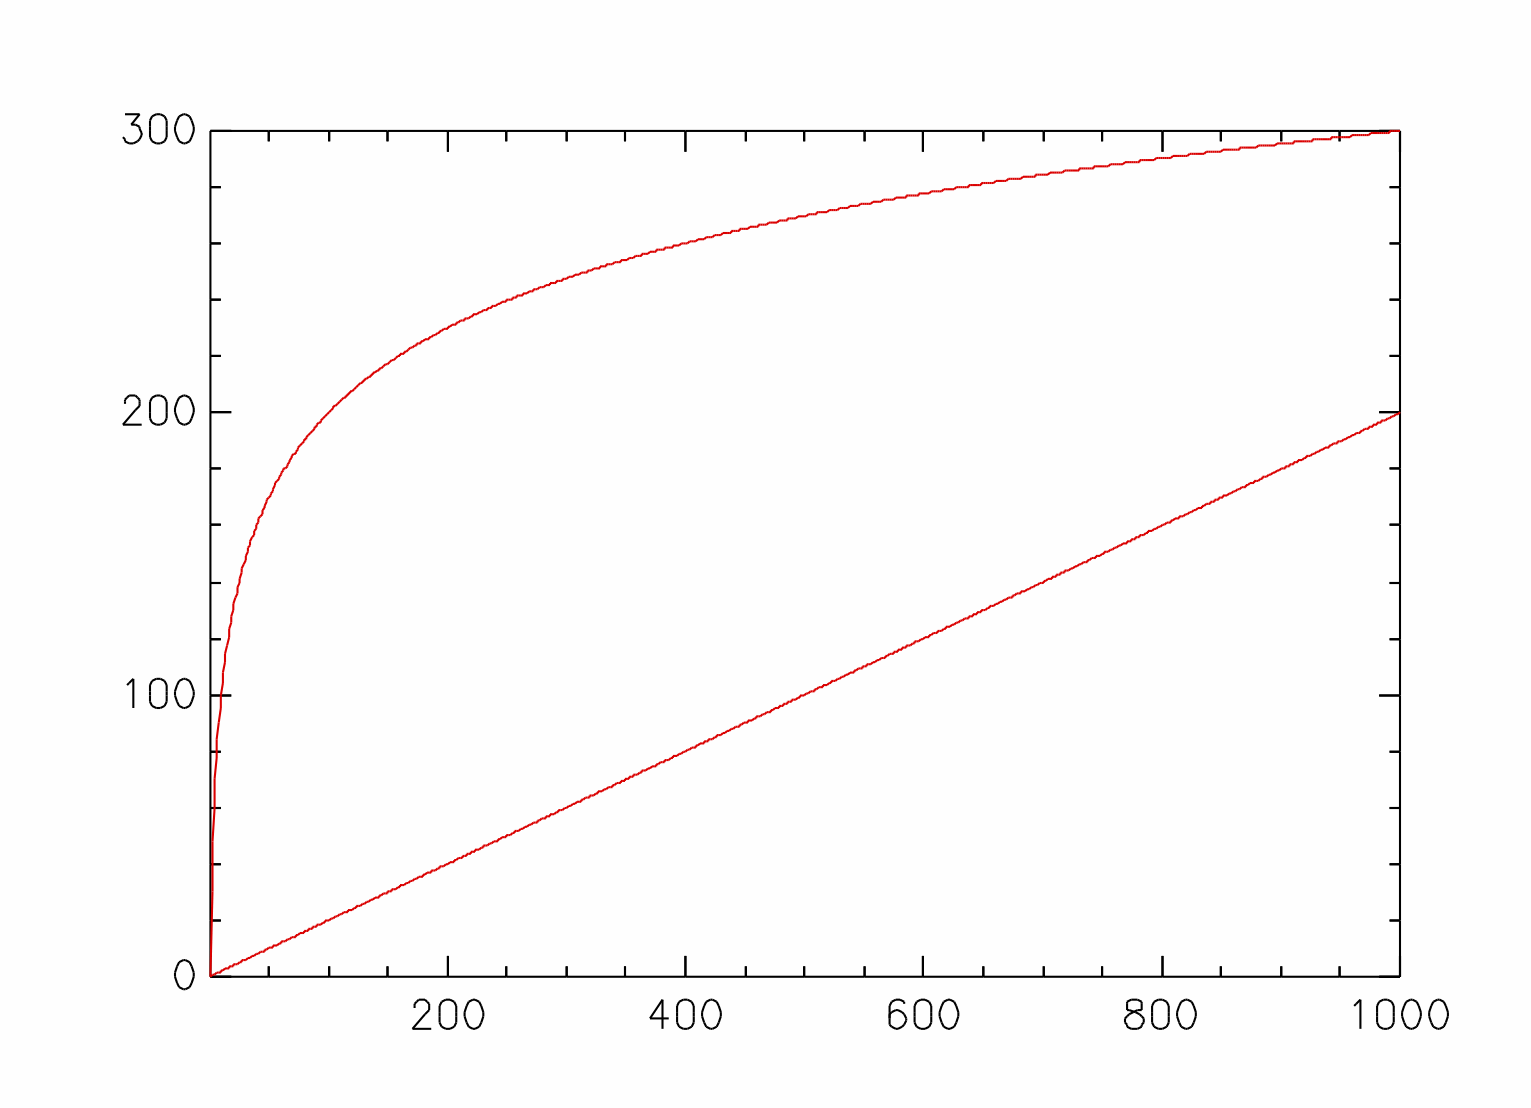
# double ~ [(100 * Log [1:1000]) ([1:1000] / 5)]
# LinePlot double PlotDefs LineDefs
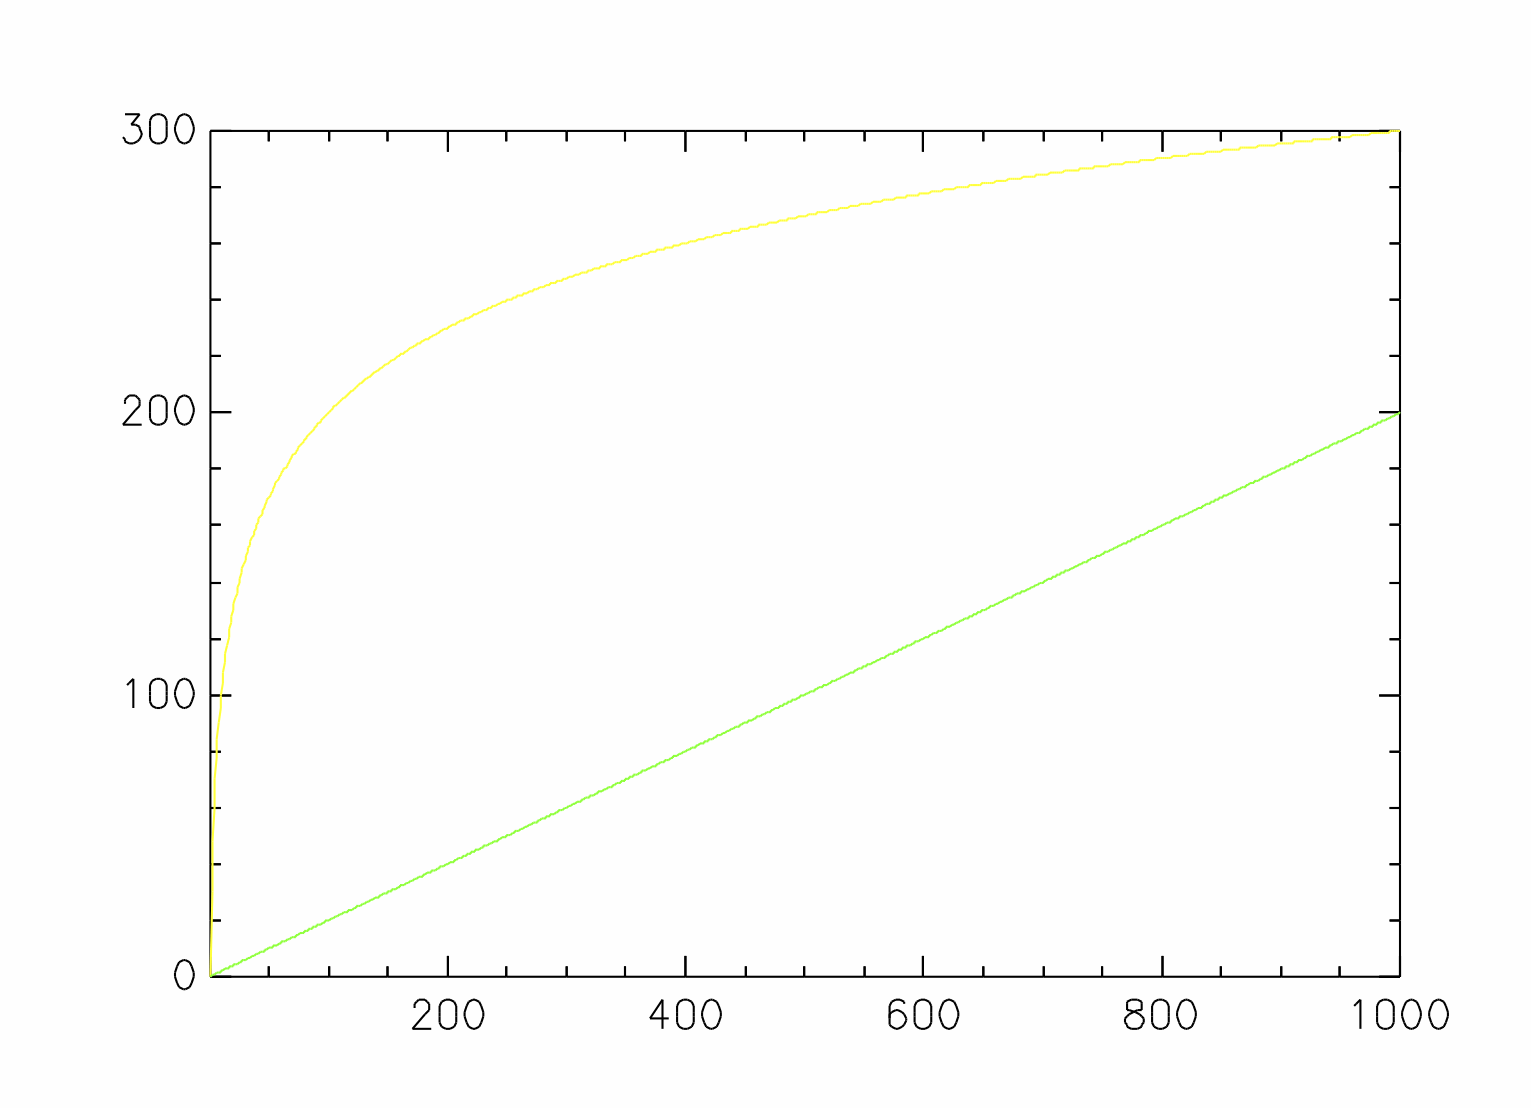
# l~LineDefs
# l'"colour"~[YELLOW GREEN]
# LinePlot double PlotDefs l
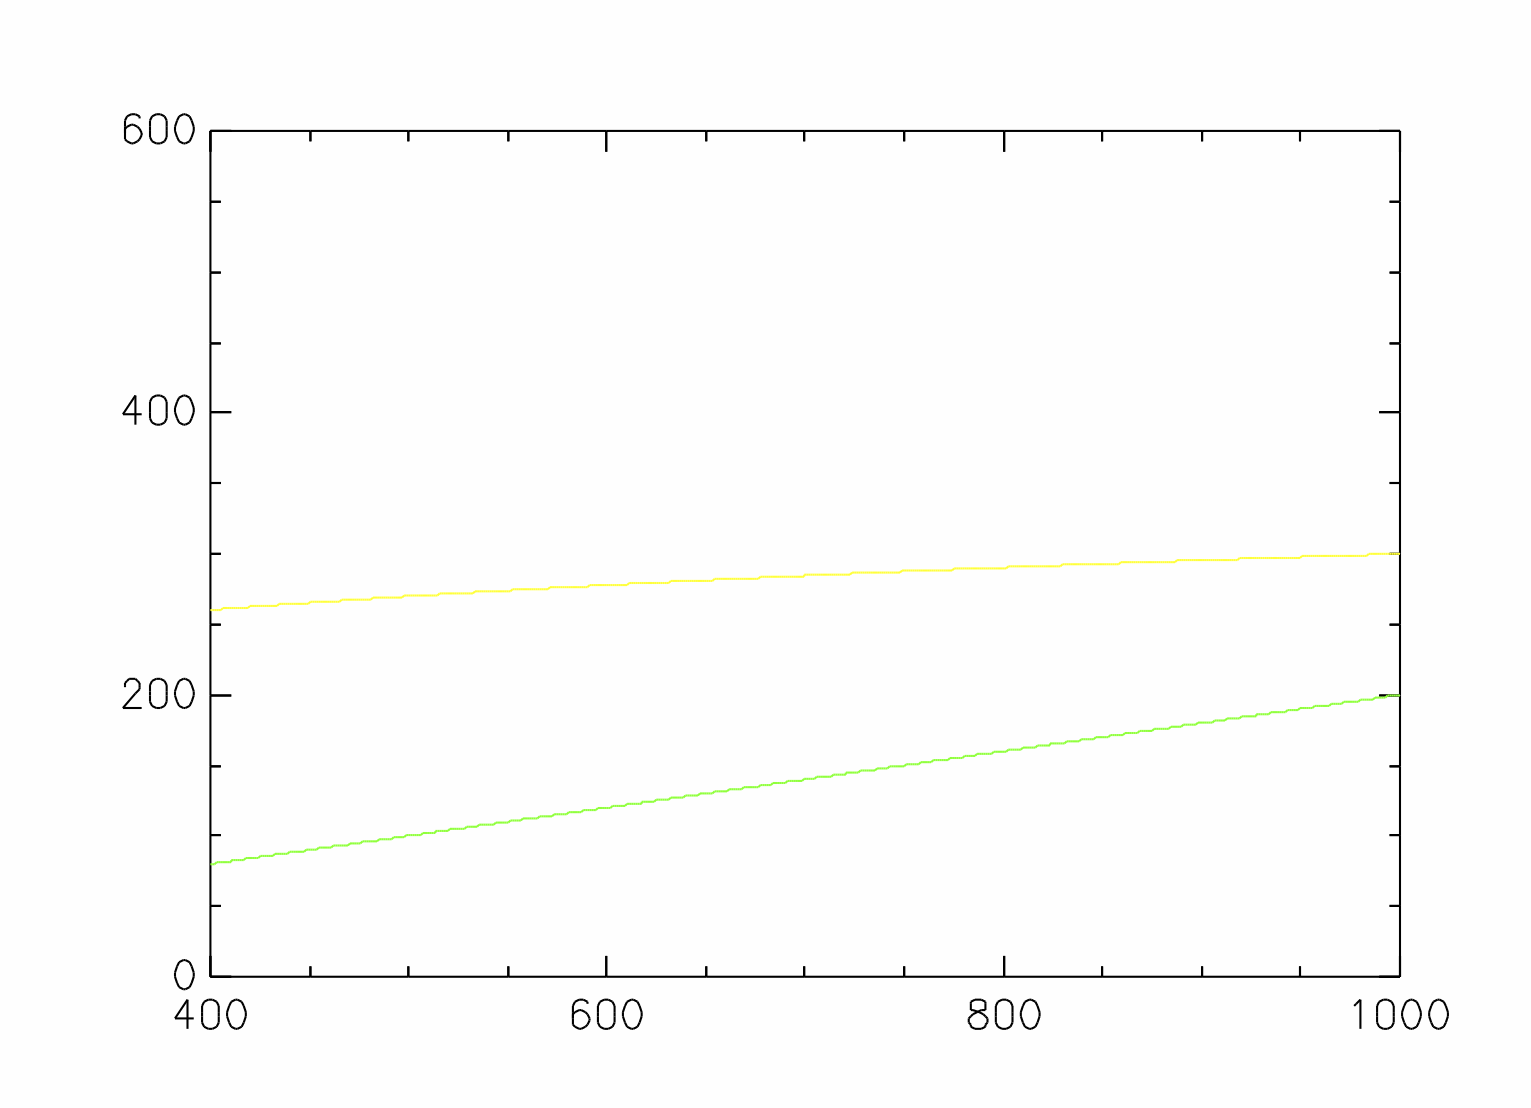
# p~PlotDefs
# p'"xmin"~400
# p'"ymax"~600
# LinePlot double p l
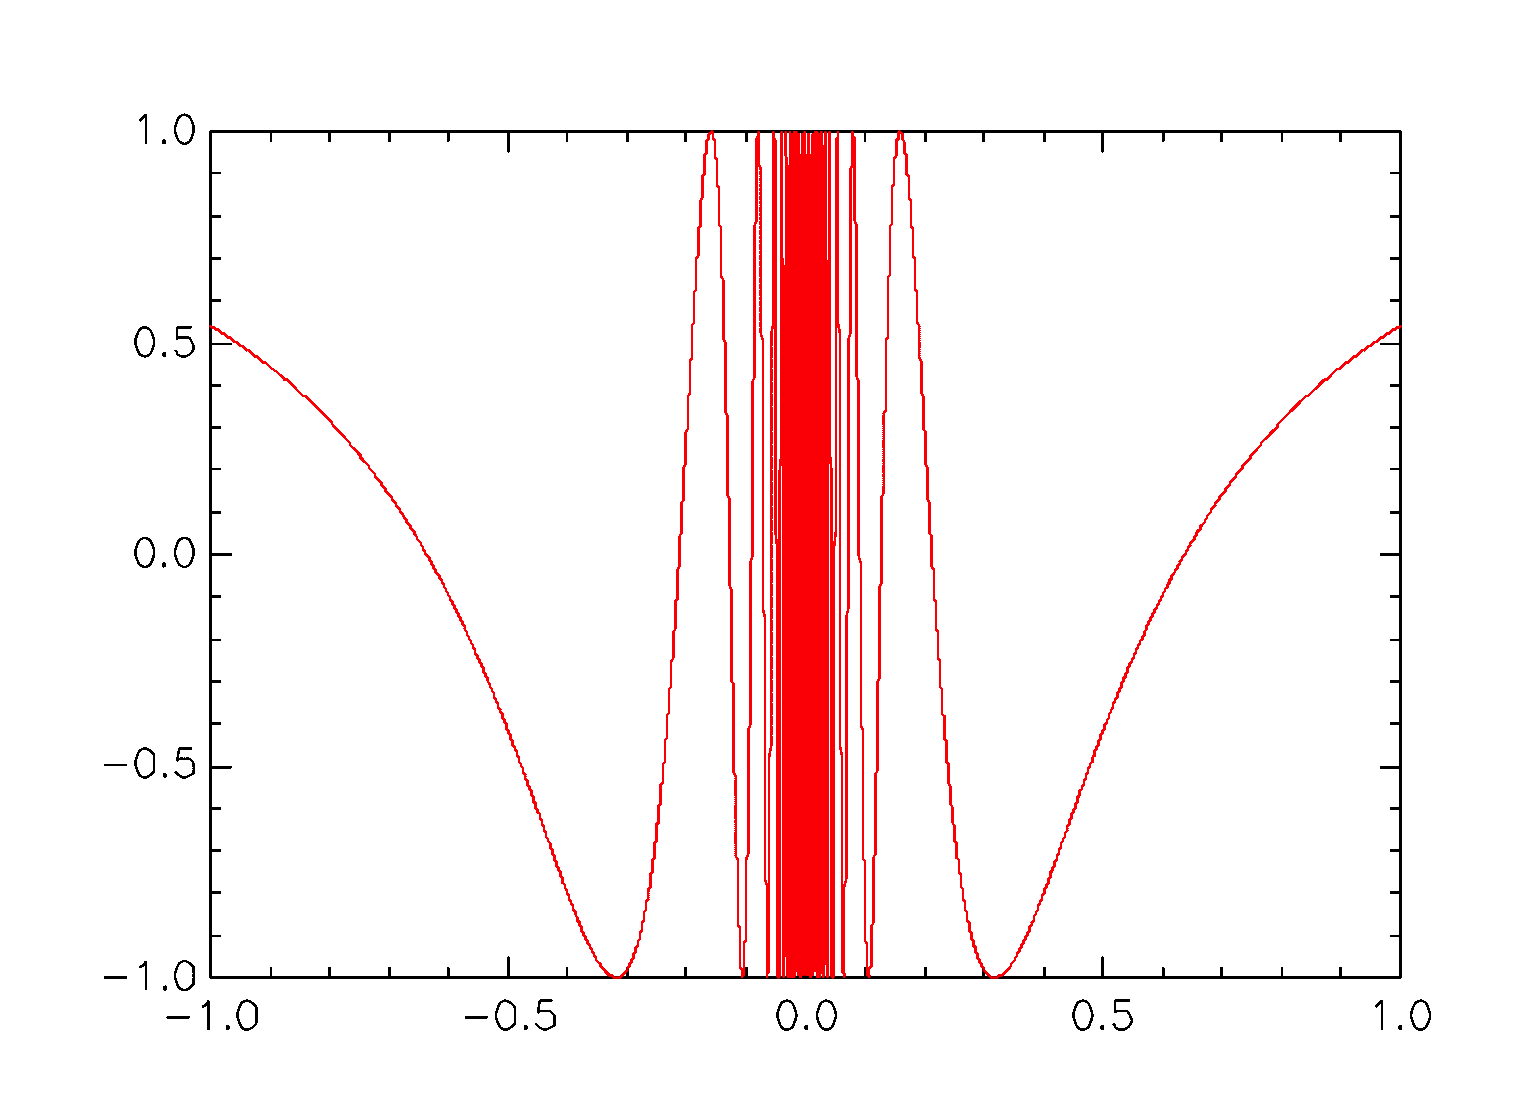
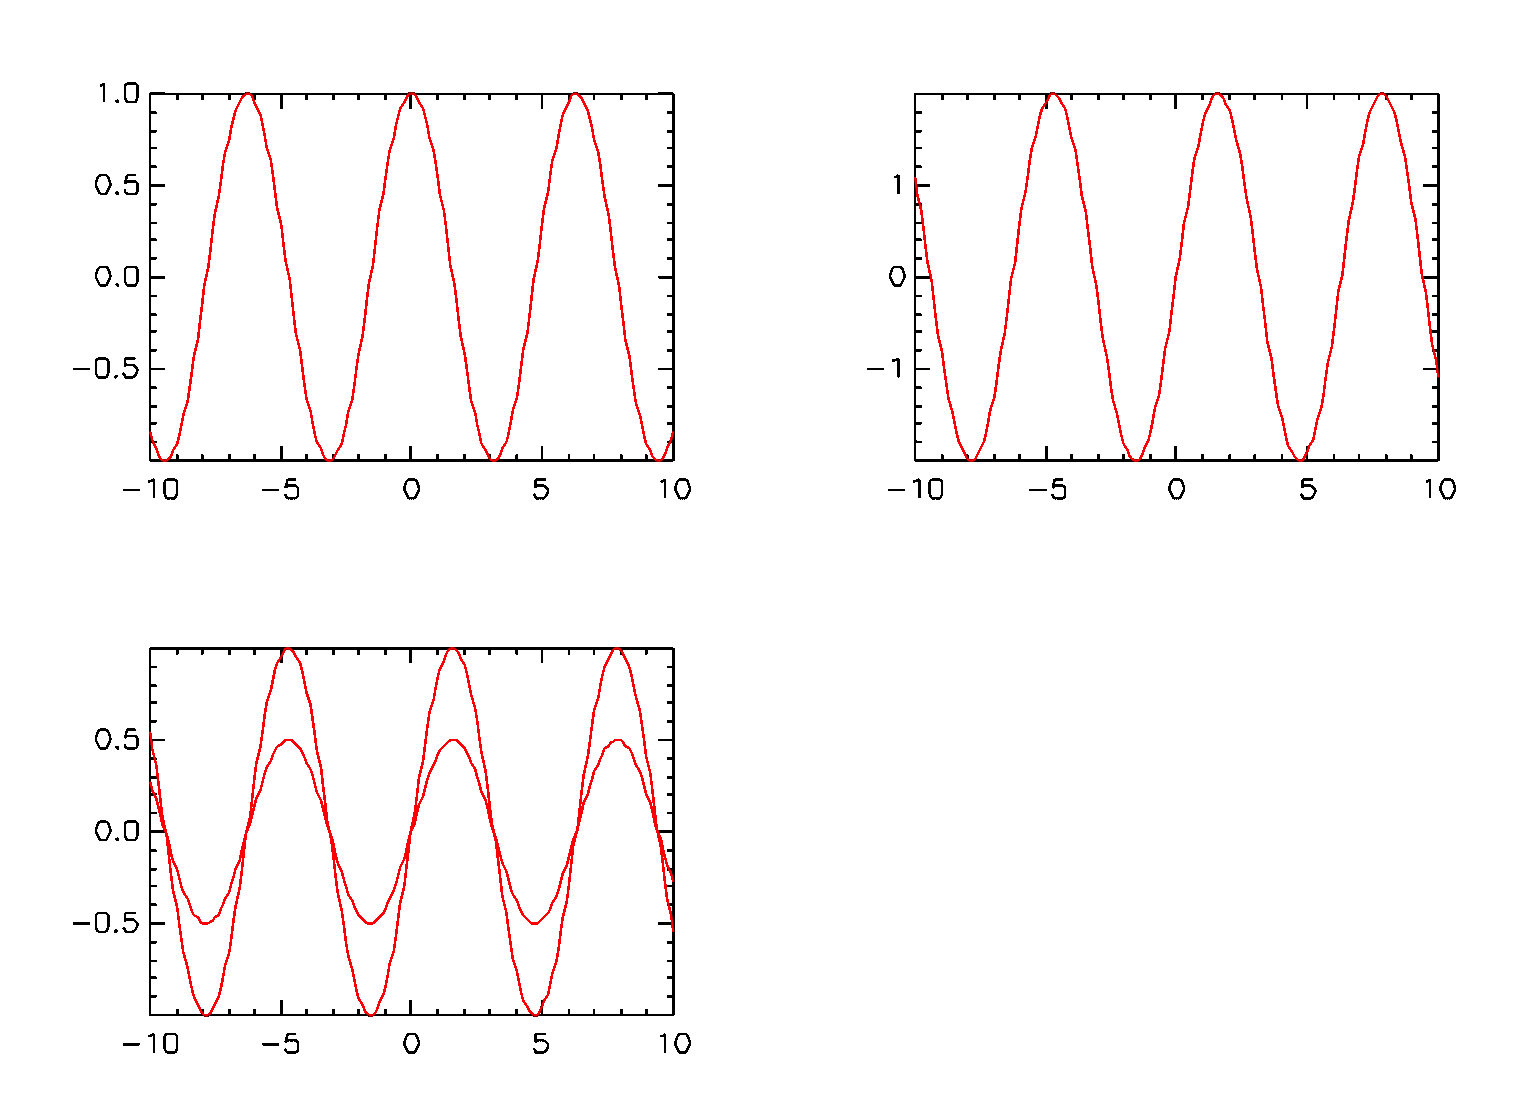
# f () x ~ Cos (1/x)
# FLinePlot @f ([-10000 : 10000] / 10000) PlotDefs LineDefs
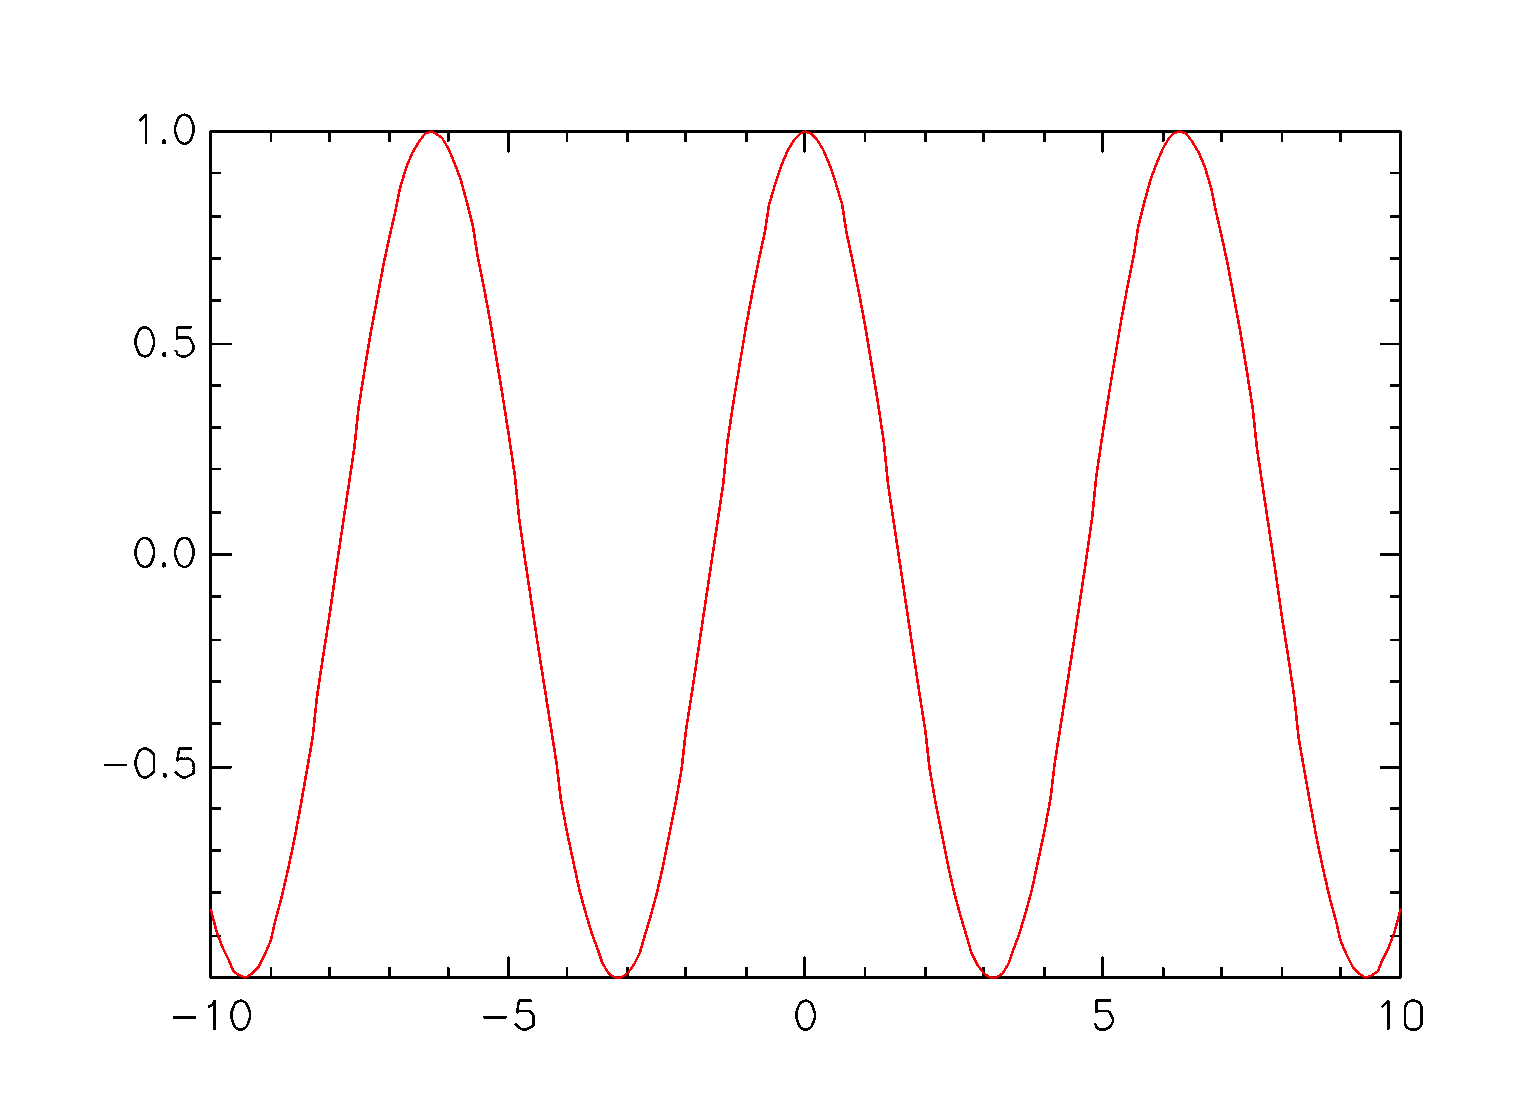
# x ~ [-100:100]/10
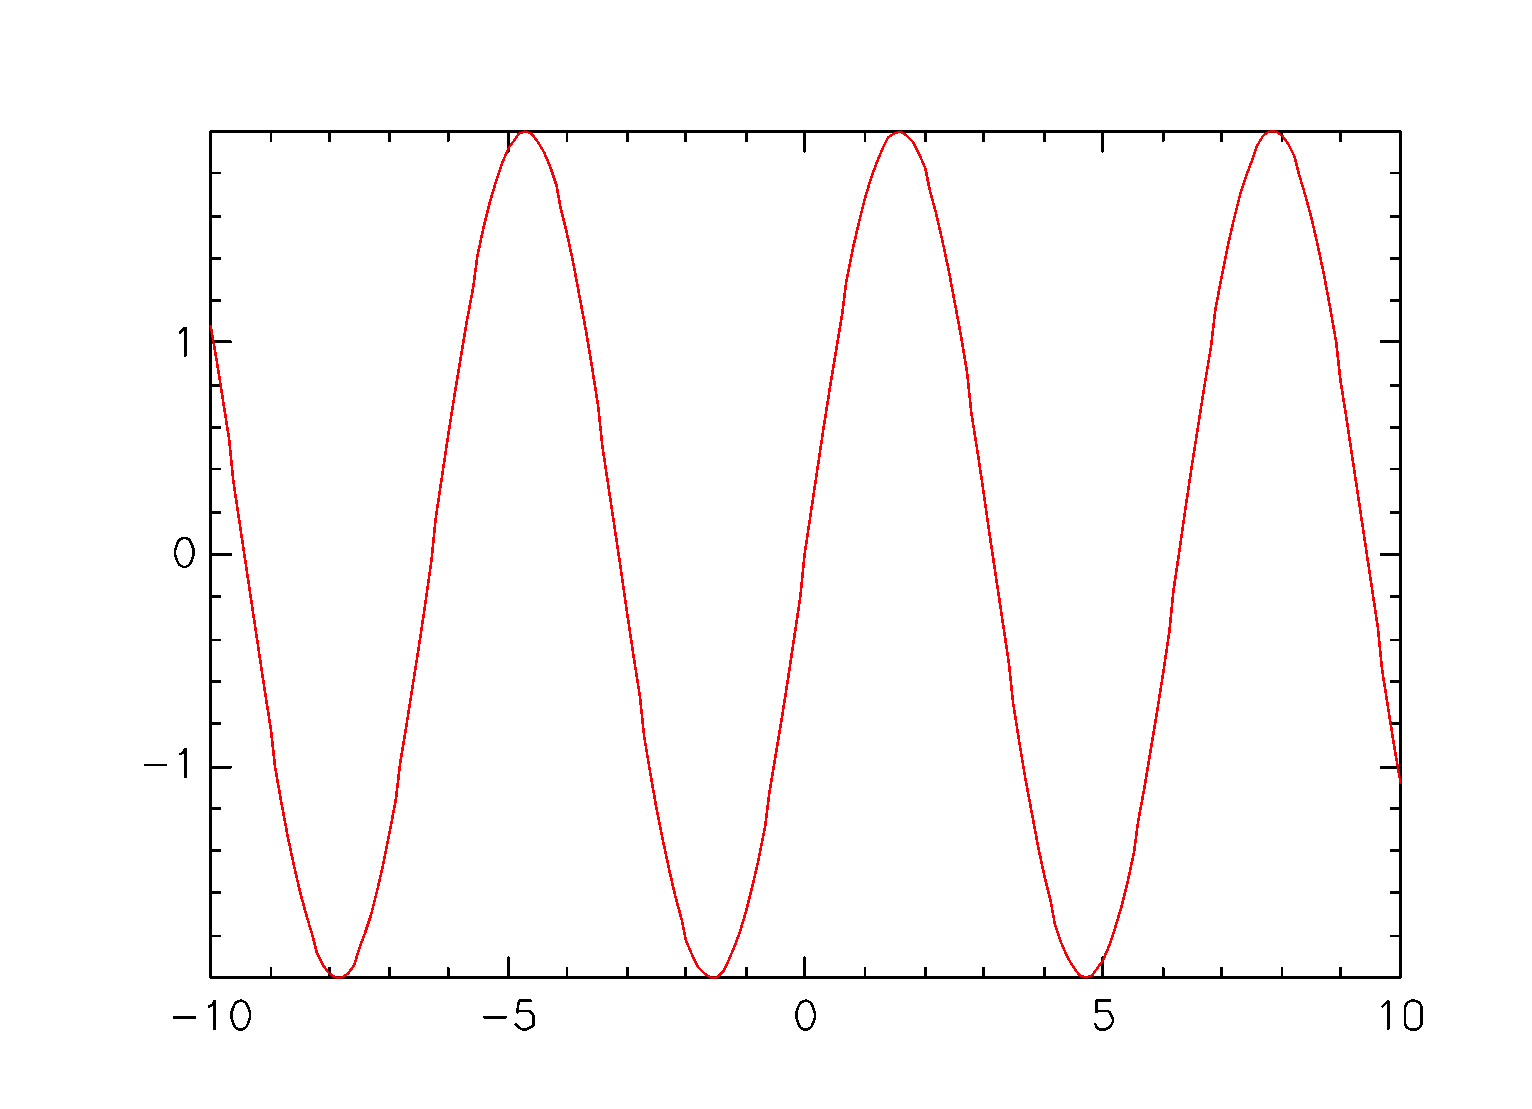
# f () x ~ 2 * Sin x
# l1 ~ FLinePlot @Cos x PlotDefs LineDefs
# l2 ~ FLinePlot @f x PlotDefs LineDefs
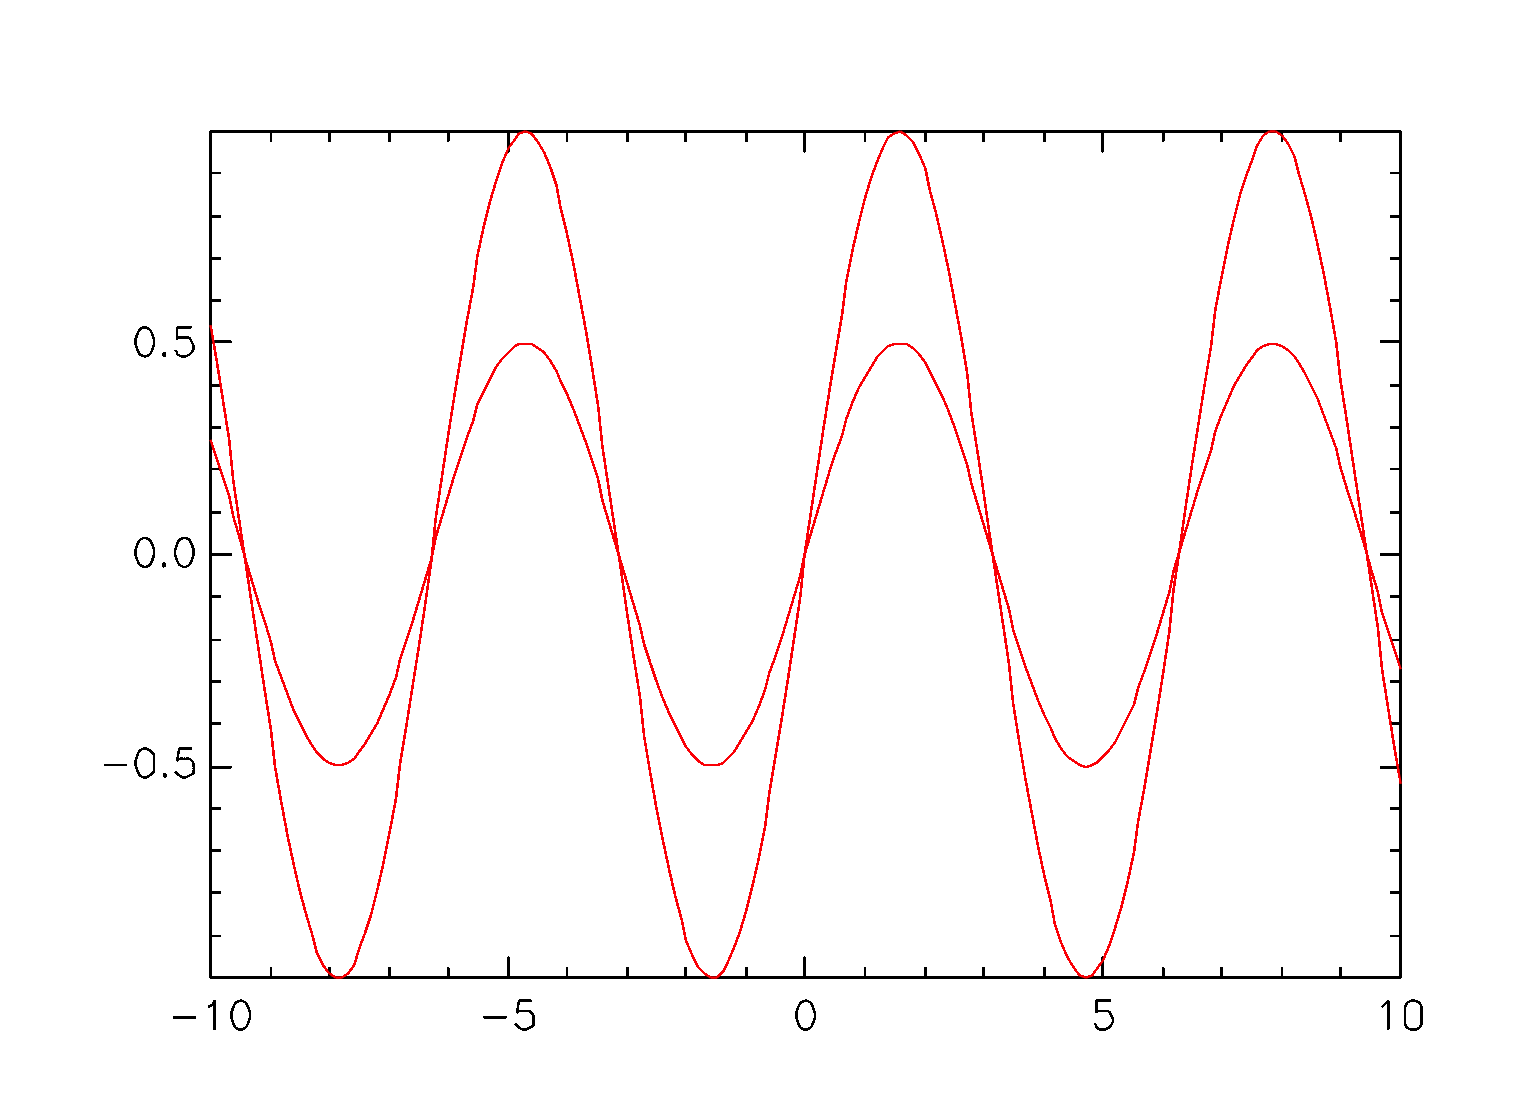
# l3 ~ LinePlot2 x [Sin x (0.5*Sin x)] PlotDefs LineDefs
# LayoutPlots [l1 l2 l3] 2
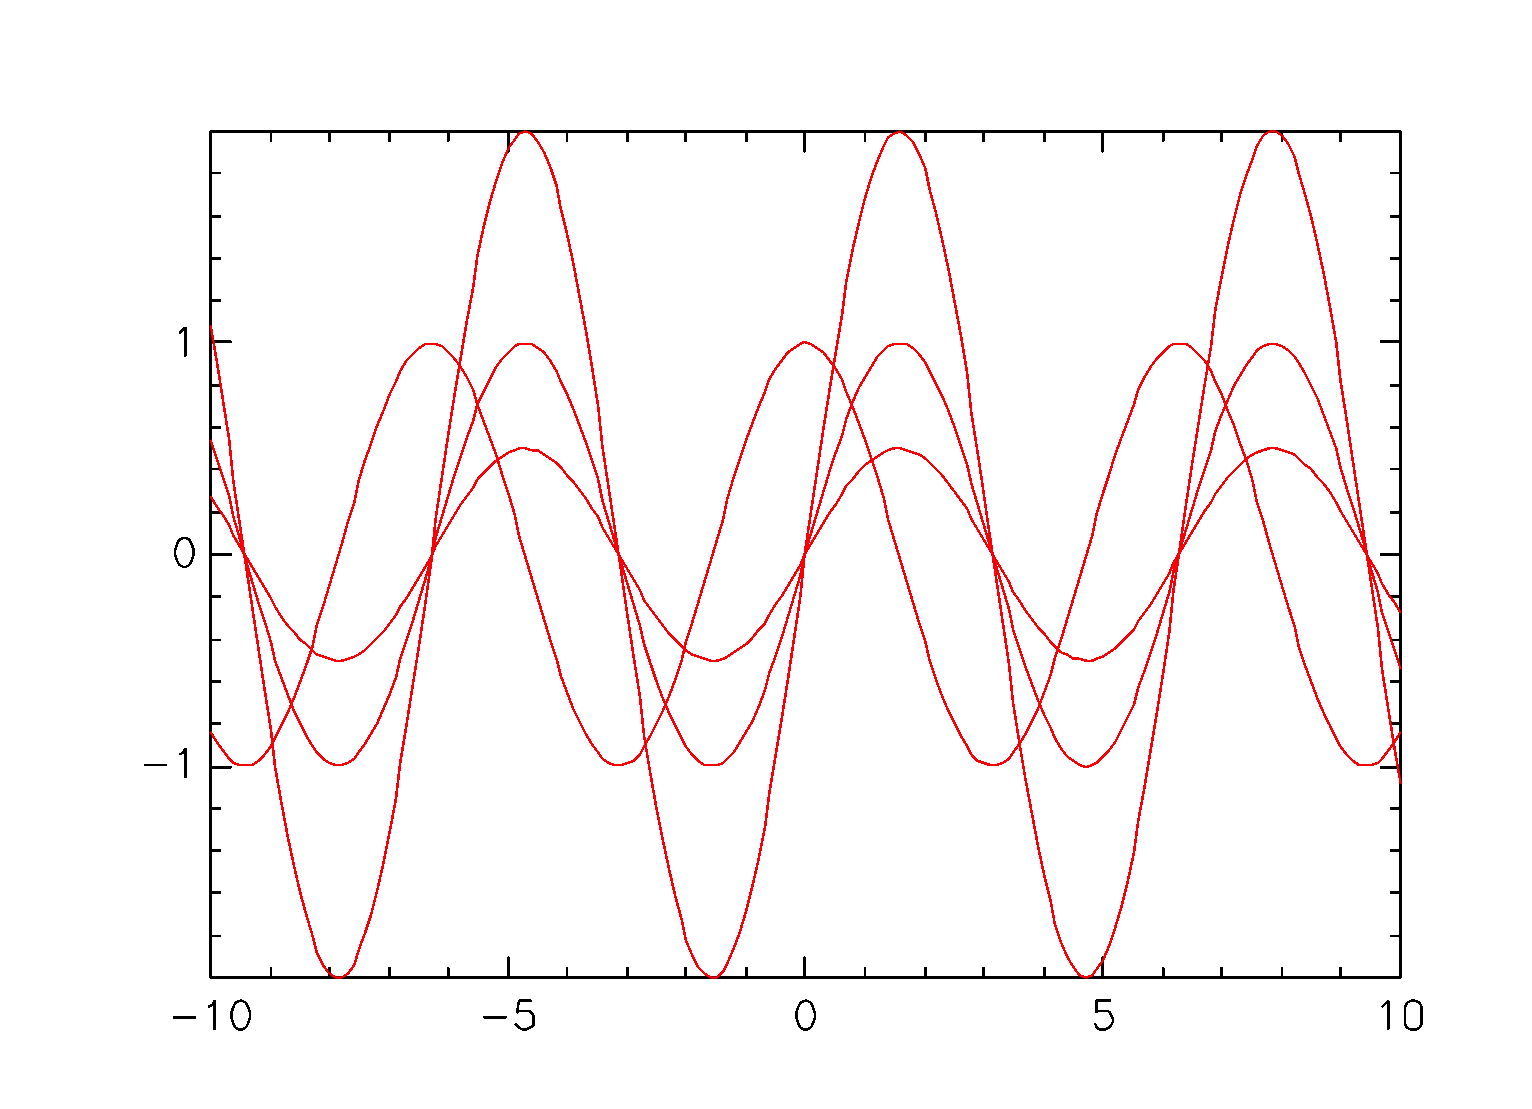
# CombineLines [l1 l2 l3]
# n~50
# x~[1:n]/2/Pi
# y~[1:n]/1/Pi
# f () x y ~ Sin x * Cos y
# z~Apply2D @f x y
# d~PlotDefs
# d'"elevation"~55
# d'"azimuth"~55
# d'"box"~LABELLED
# d'"axis"~LINEAR
# d'"xlabel"~"x-axis"
# d'"ylabel"~"y-axis"
# d'"zlabel"~"z-axis"
# d'"title"~"plot"
# s~SurfaceDefs
# s'"colour"~RED
# SurfacePlot x y z d s
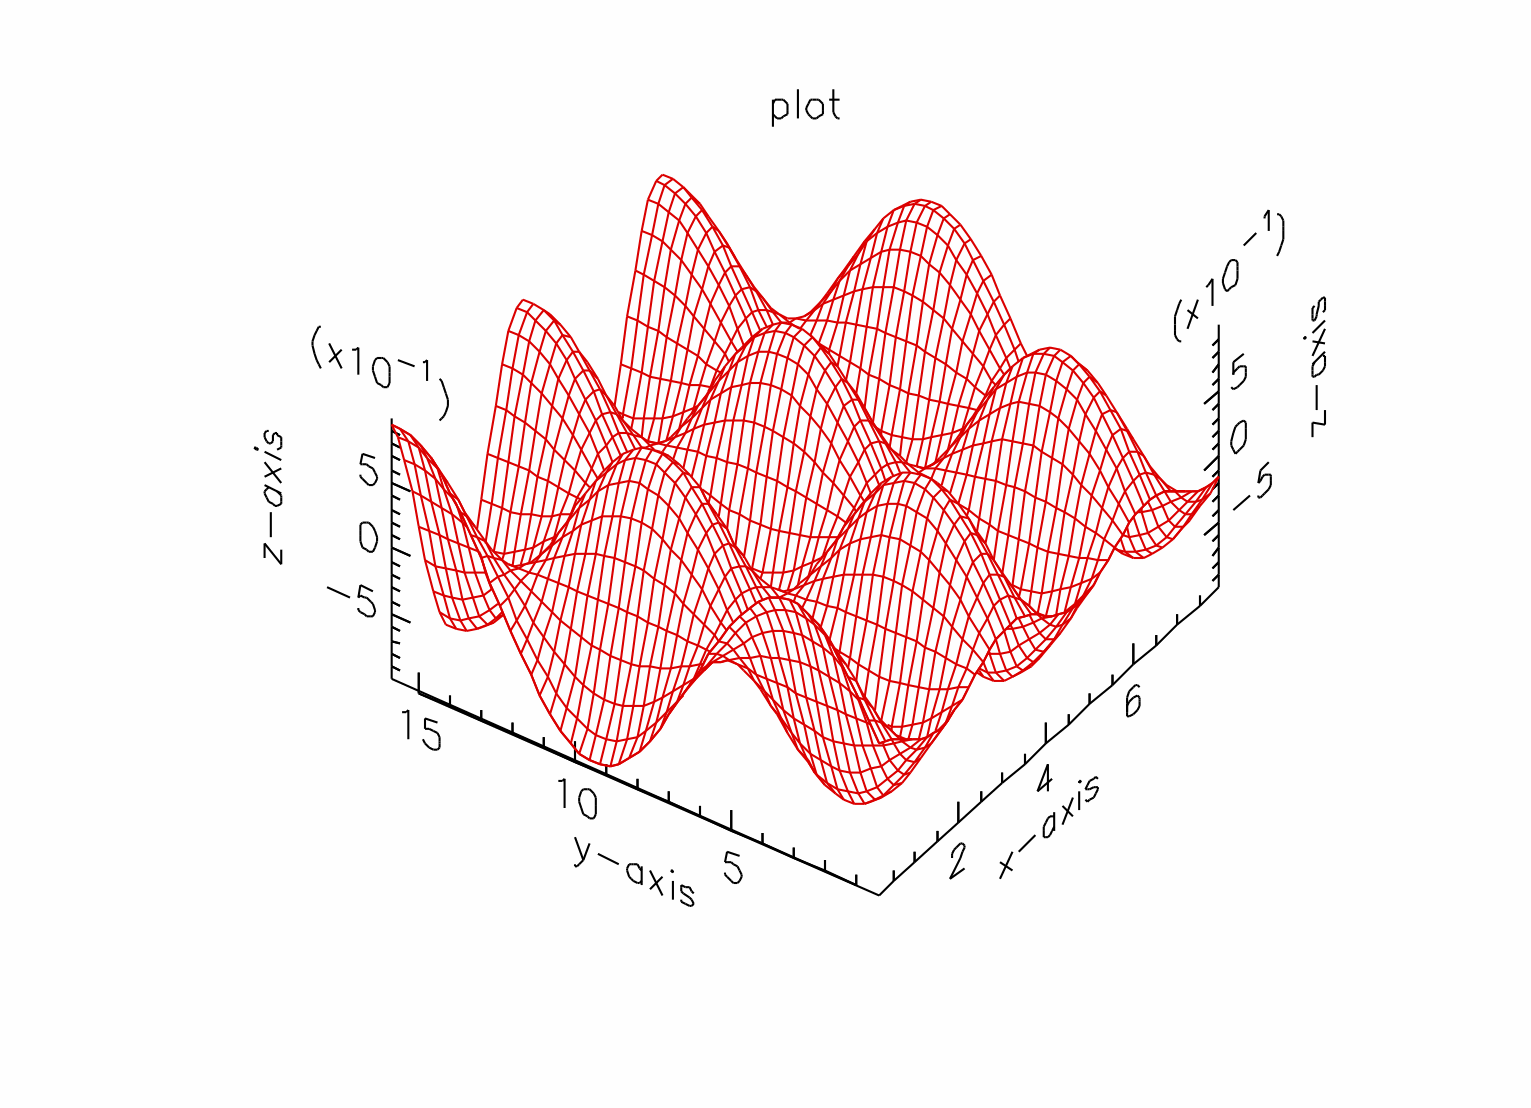
# d'"fill"~SOLID
# SurfacePlot x y z d s
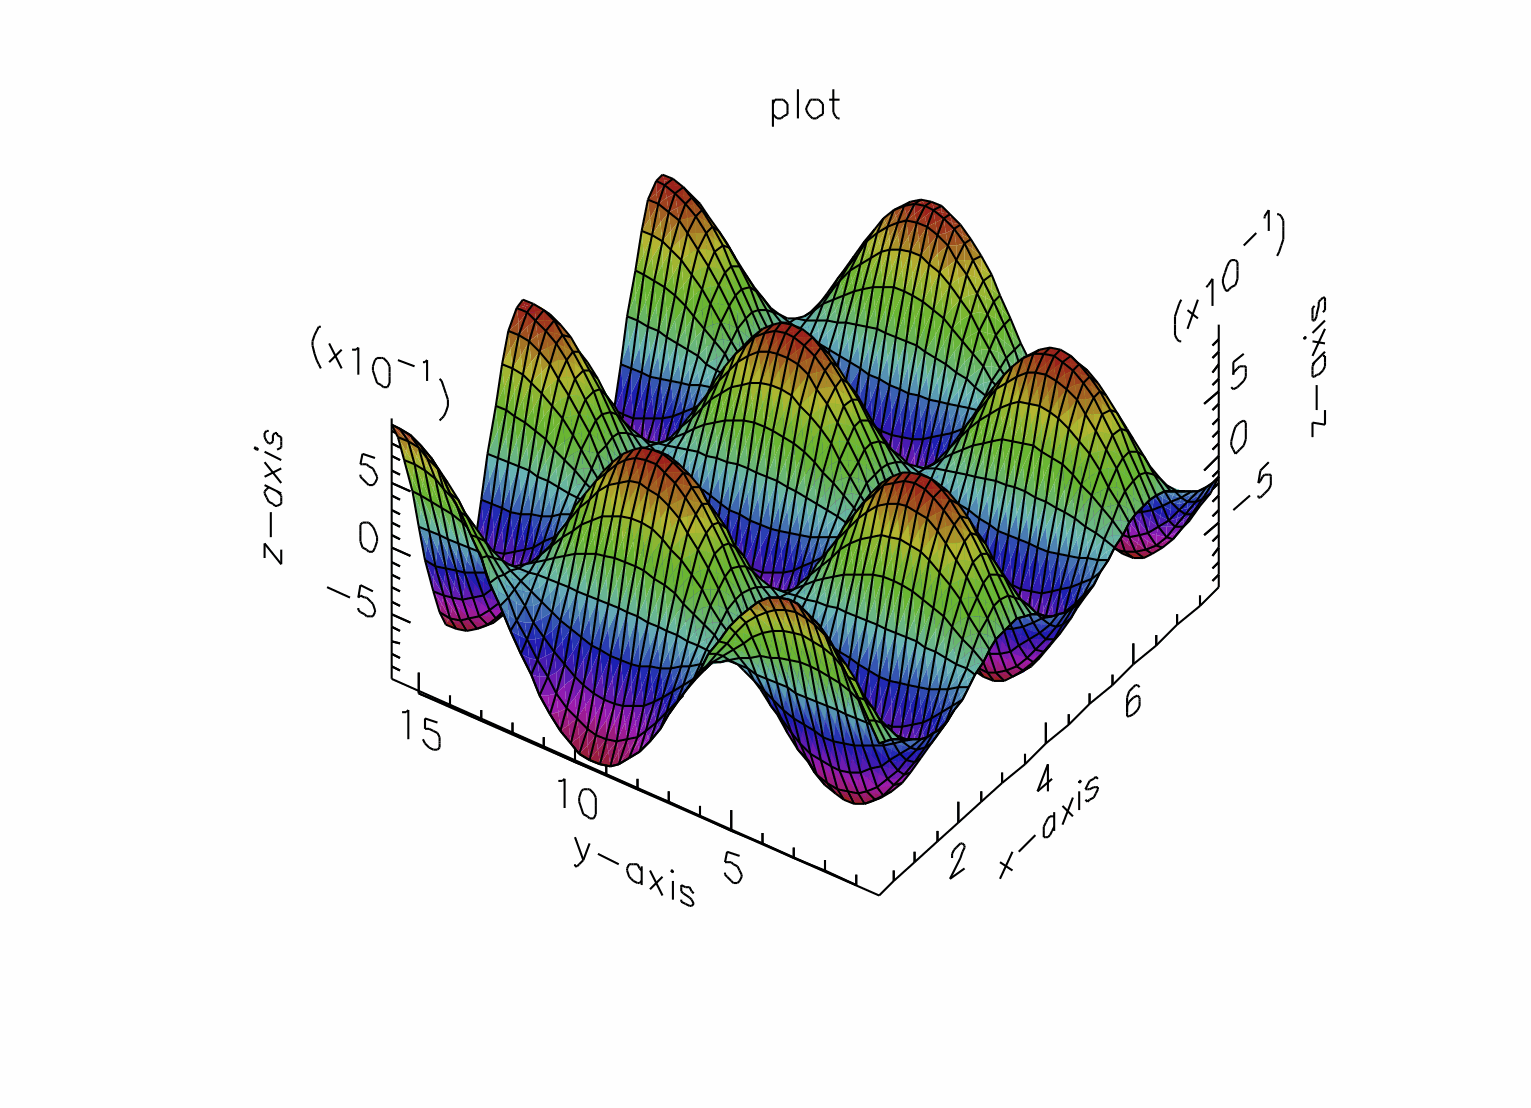
# s'"mesh"~NOMESH
# SurfacePlot x y z d s
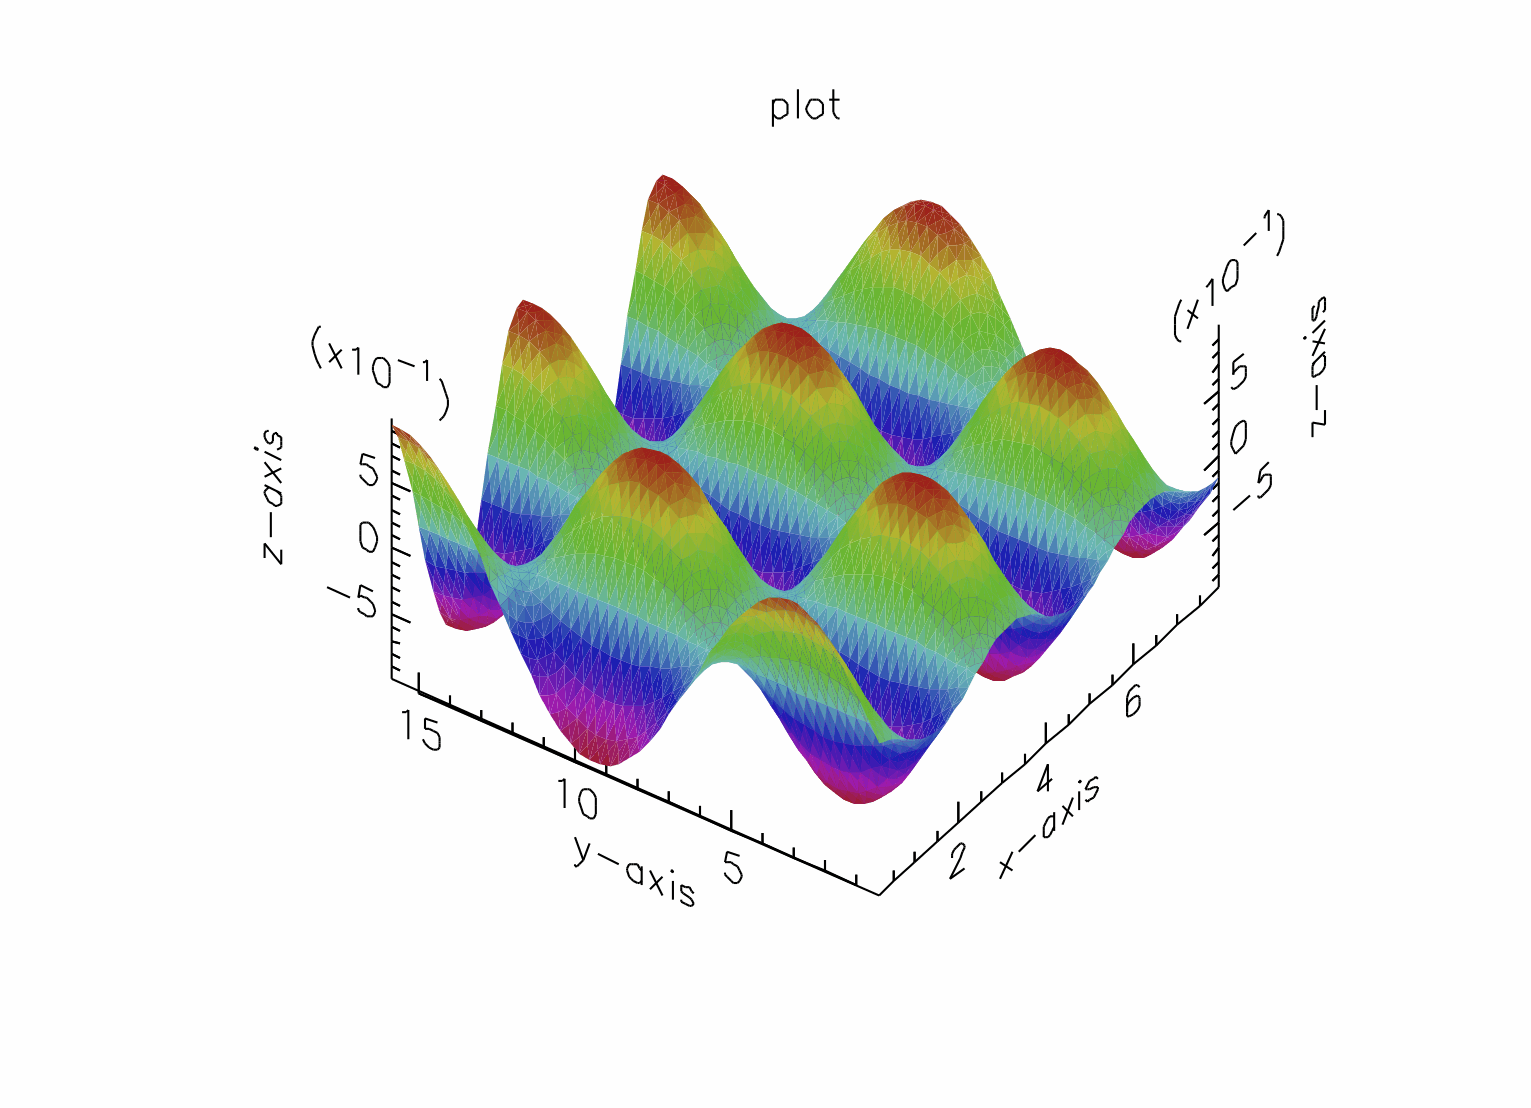
# d'"fill"~SHADED
# SurfacePlot x y z d s
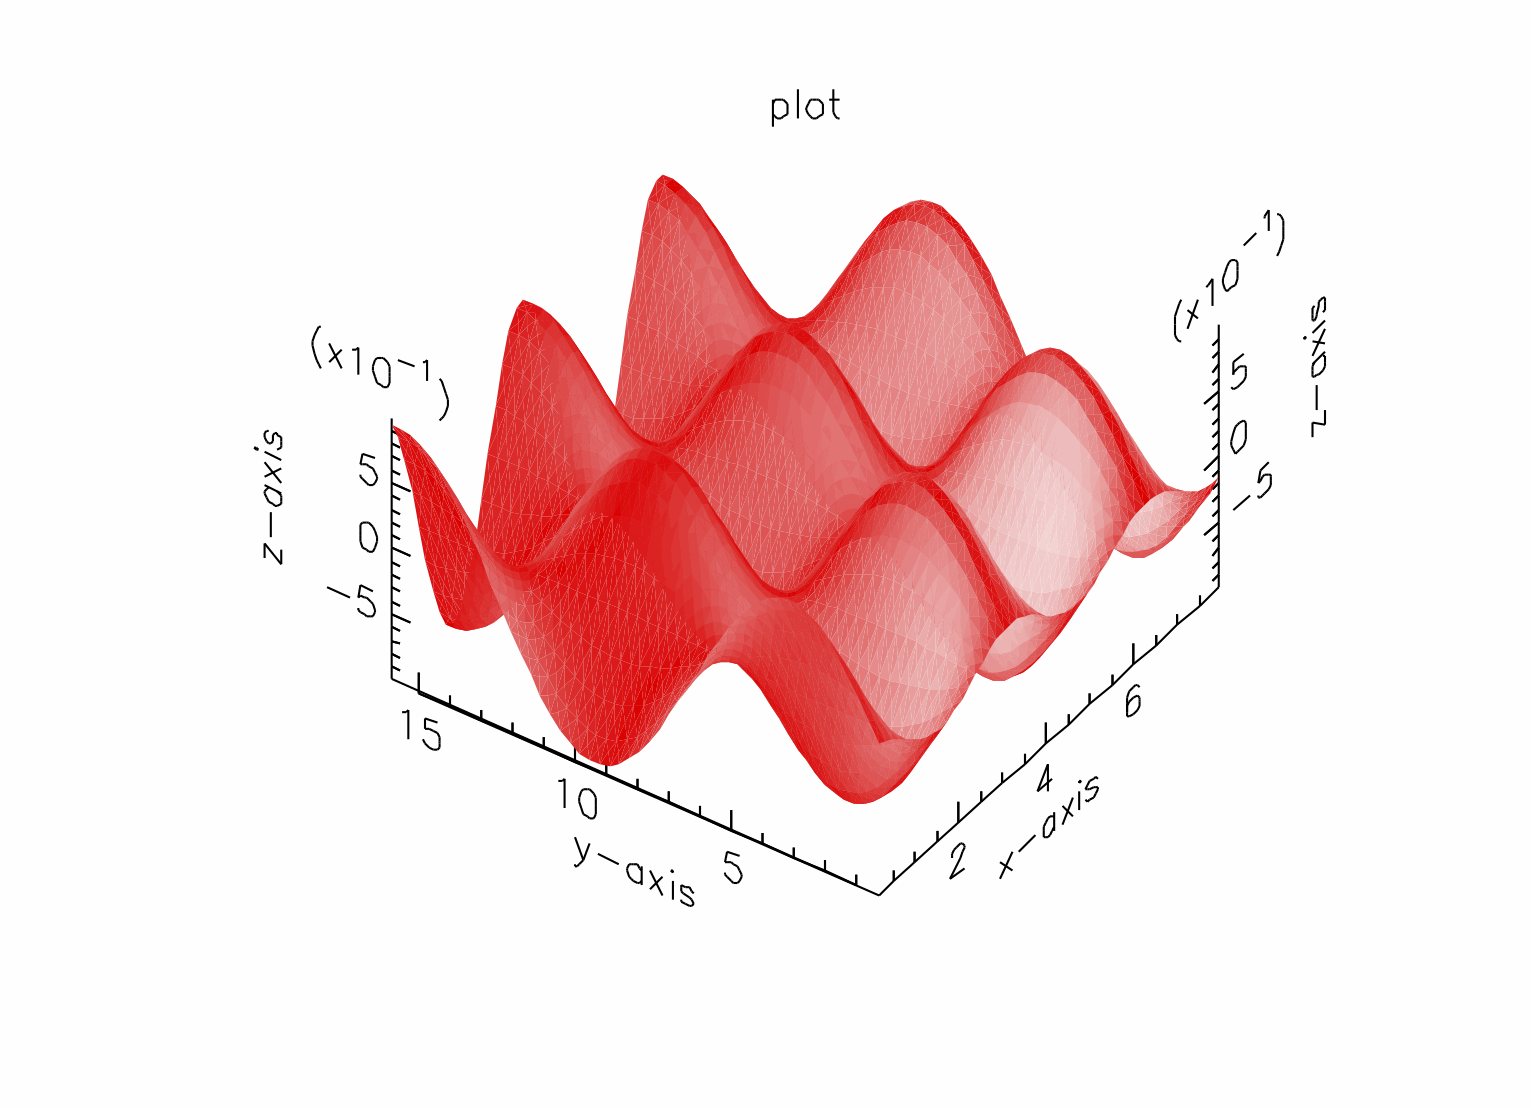
# s'"colour"~GREY
# SurfacePlot x y z d s
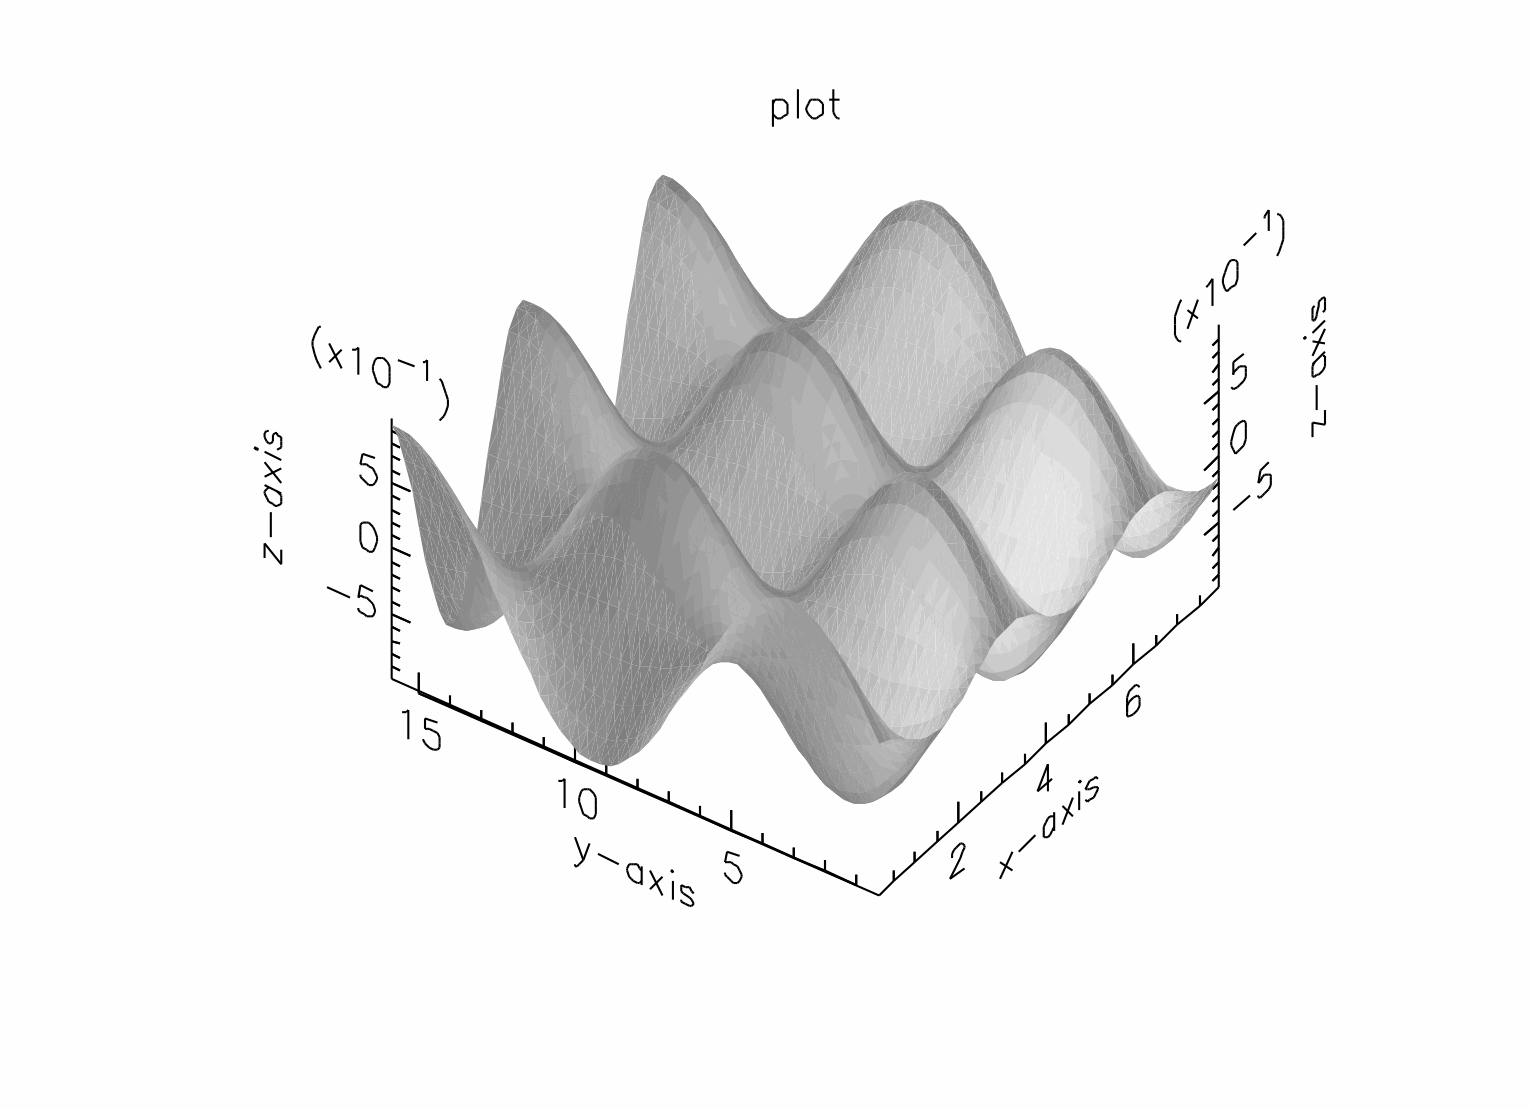
# ContourPlot x y z d s
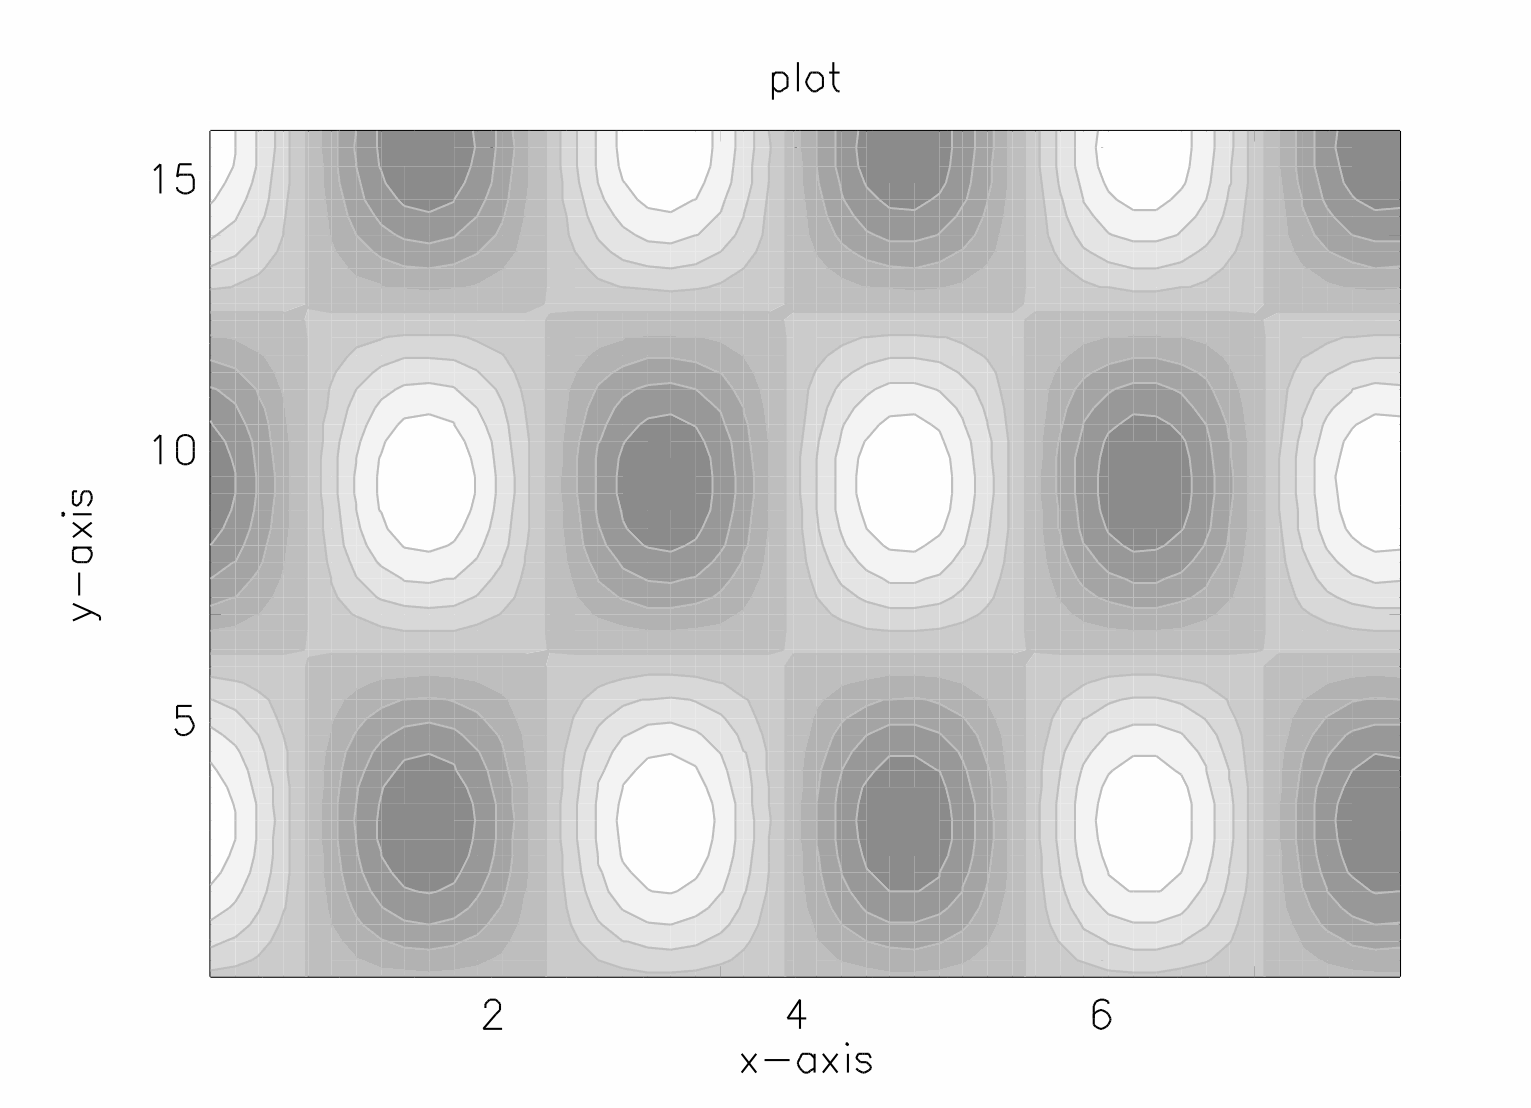
# d'"fill"~HATCHED
# ContourPlot x y z d s
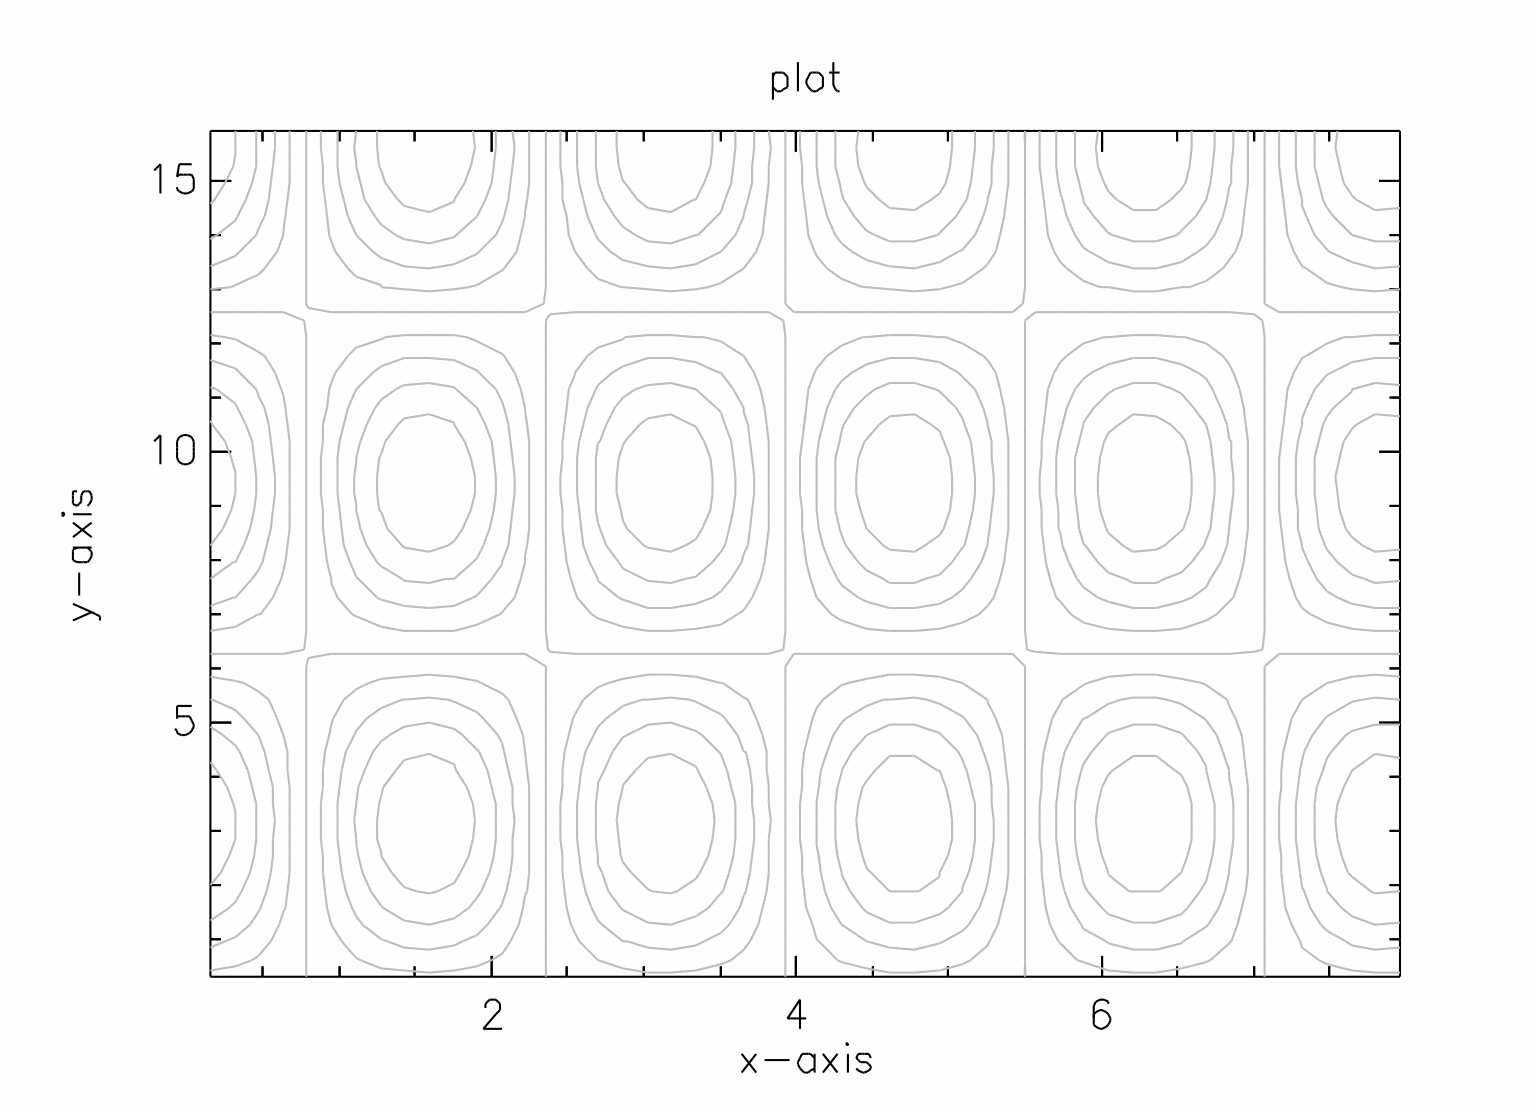
# n~50
# x~[1:n]/2/Pi
# y~[1:n]/3/Pi
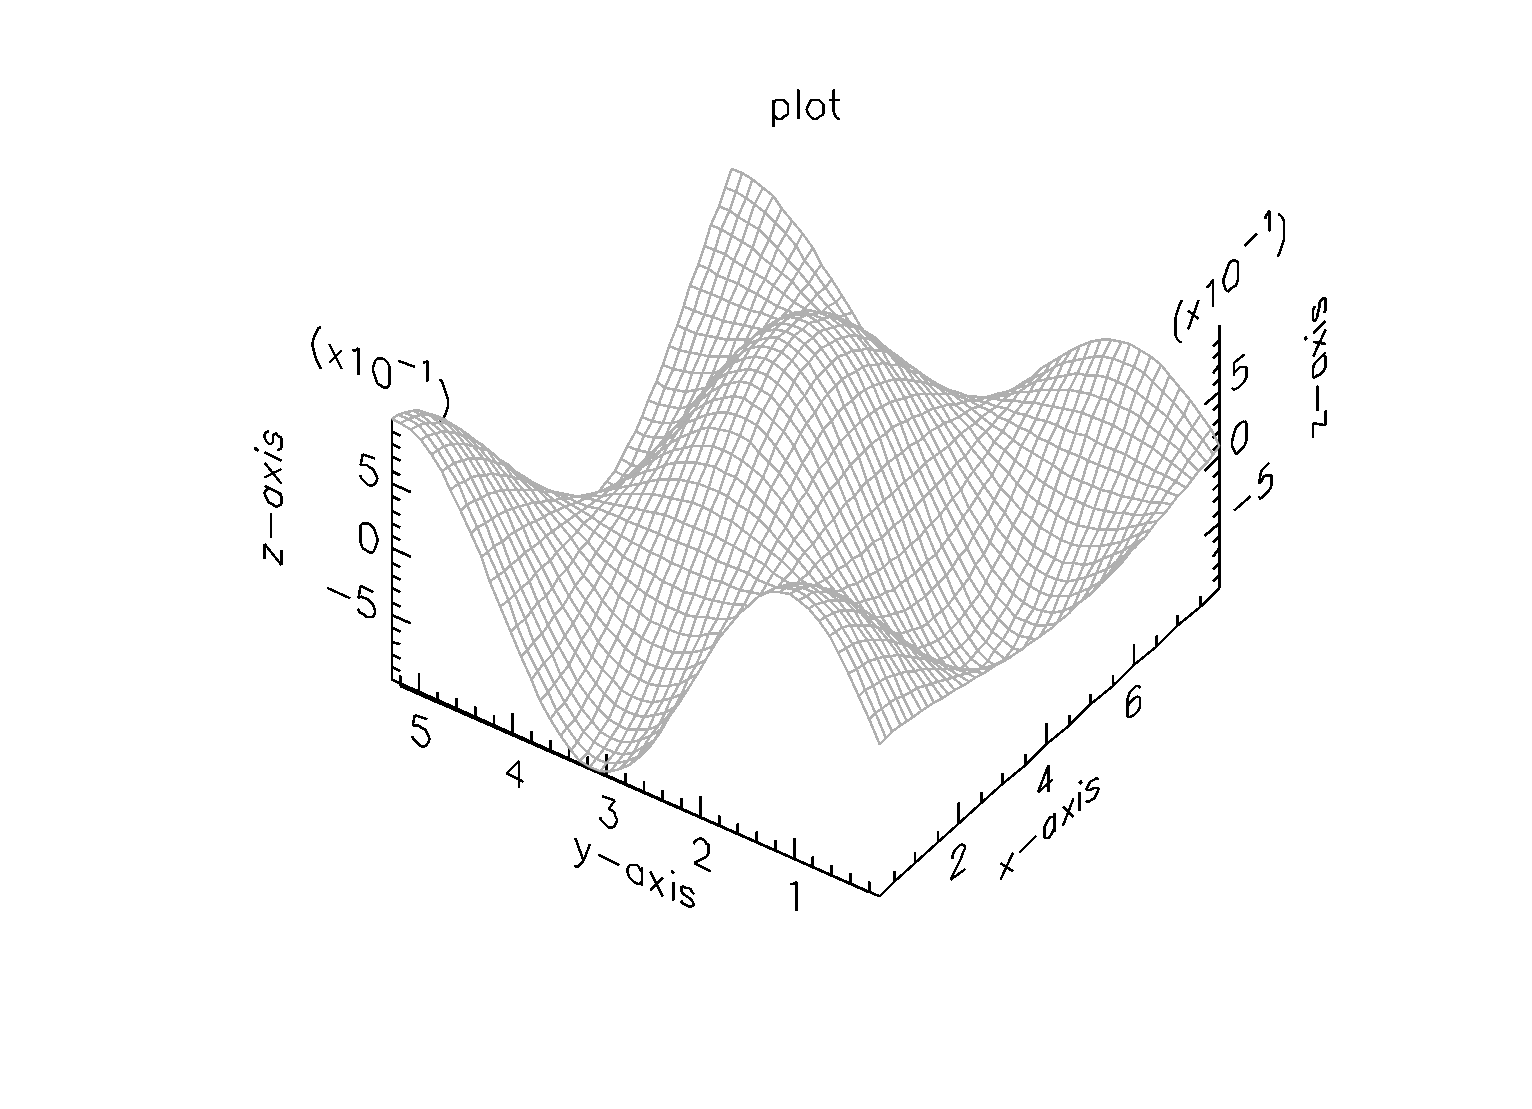
# FSurfacePlot @f x y d s
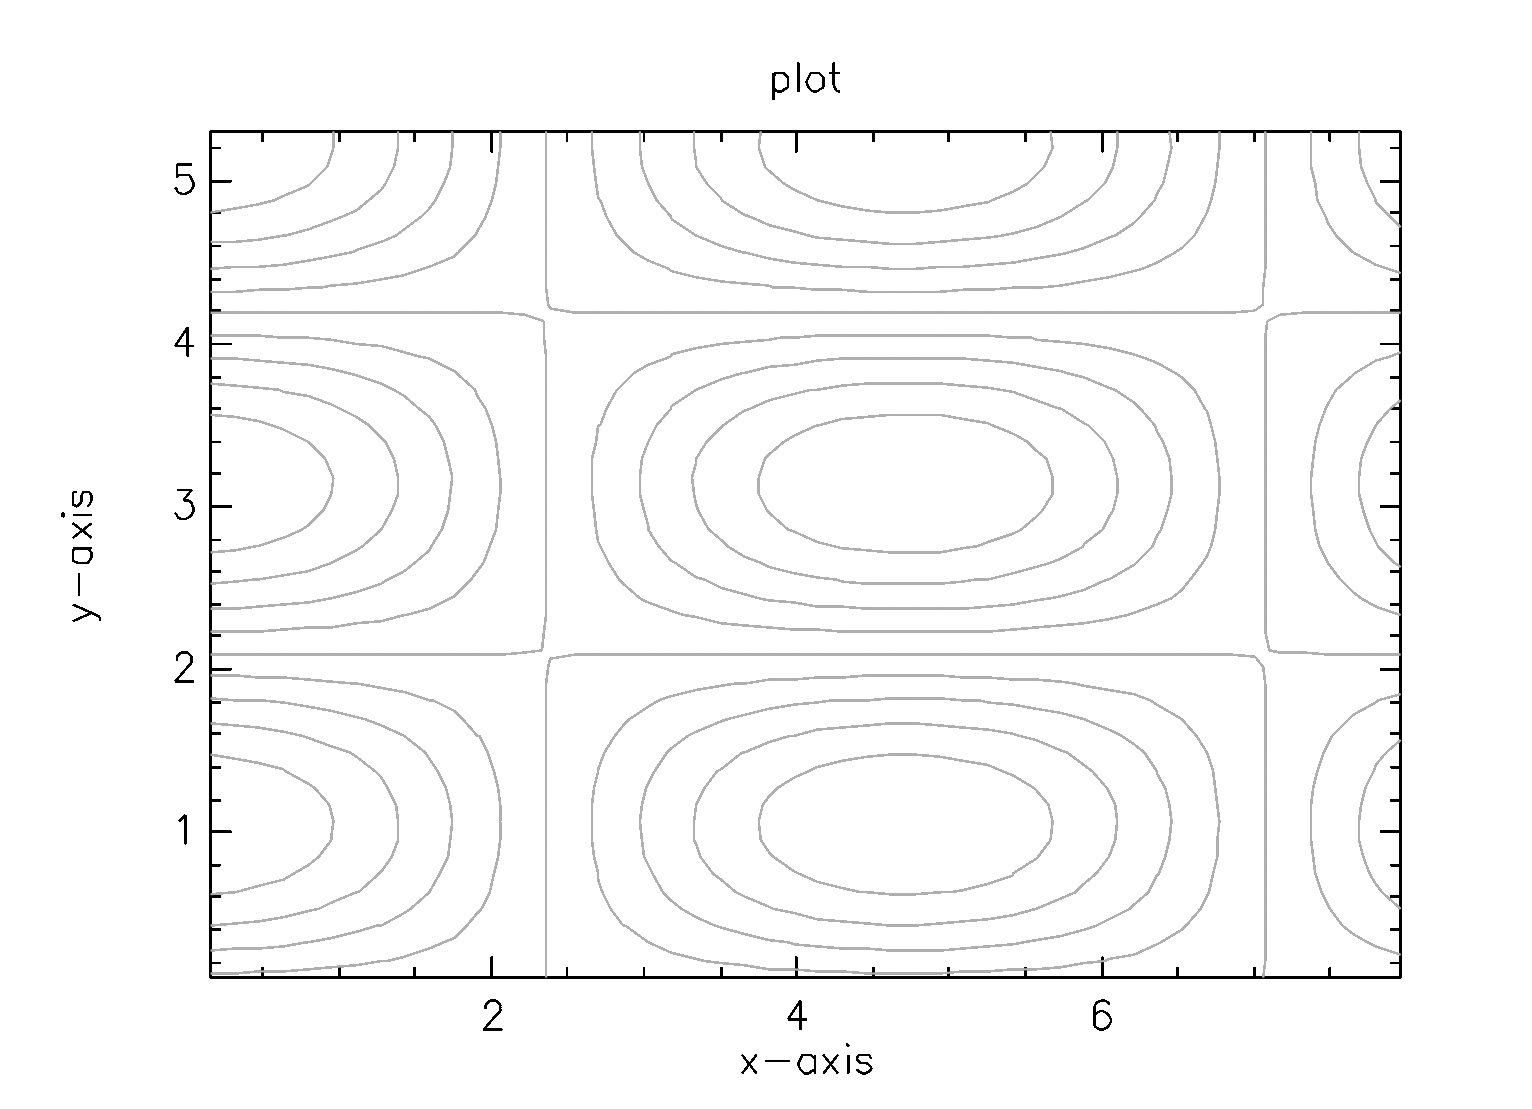
# FContourPlot @f x y d s
# /q
Bye